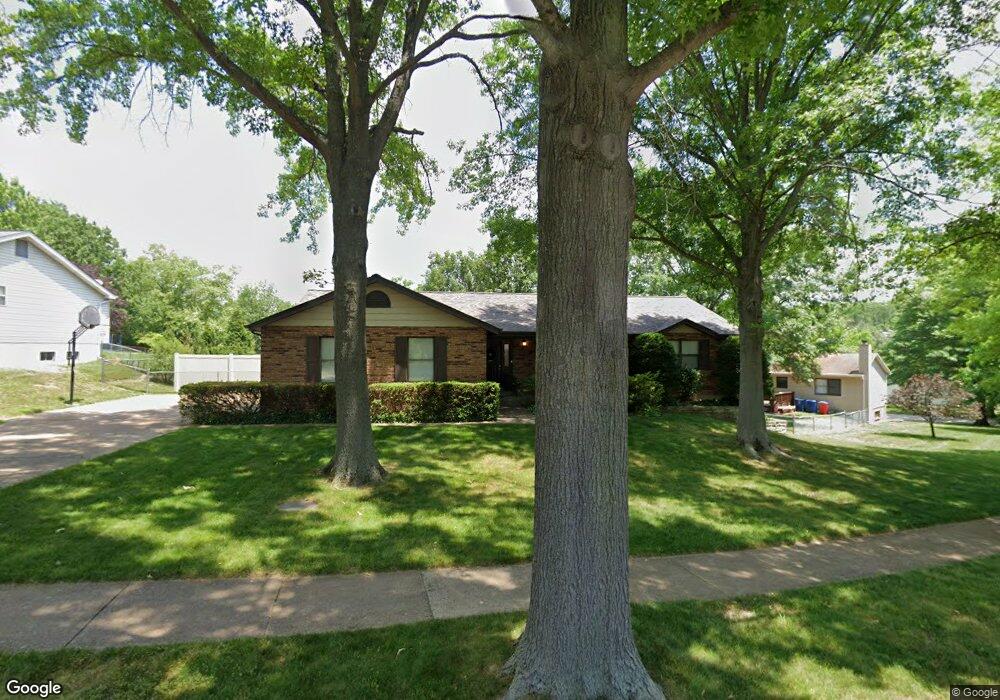
1315 Summit Dr Fenton, MO 63026
Estimated Value: $359,280 - $472,000
3
Beds
2
Baths
1,580
Sq Ft
$256/Sq Ft
Est. Value
About This Home
This home is located at 1315 Summit Dr, Fenton, MO 63026 and is currently estimated at $404,320, approximately $255 per square foot. 1315 Summit Dr is a home located in St. Louis County with nearby schools including Bowles Elementary School, Rockwood South Middle School, and Rockwood Summit Senior High School.
Ownership History
Date
Name
Owned For
Owner Type
Purchase Details
Closed on
Apr 29, 2016
Bought by
Pancer Donald L
Current Estimated Value
Home Financials for this Owner
Home Financials are based on the most recent Mortgage that was taken out on this home.
Original Mortgage
$50,000
Outstanding Balance
$39,696
Interest Rate
3.66%
Estimated Equity
$364,624
Purchase Details
Closed on
Oct 25, 2002
Sold by
Naum Salvatore A and Naum Diane
Bought by
Pancer Donald L and Pancer Genevieve F
Home Financials for this Owner
Home Financials are based on the most recent Mortgage that was taken out on this home.
Original Mortgage
$116,000
Interest Rate
5.44%
Create a Home Valuation Report for This Property
The Home Valuation Report is an in-depth analysis detailing your home's value as well as a comparison with similar homes in the area
Purchase History
| Date | Buyer | Sale Price | Title Company |
|---|---|---|---|
| Pancer Donald L | -- | -- | |
| Pancer Donald L | $218,500 | -- |
Source: Public Records
Mortgage History
| Date | Status | Borrower | Loan Amount |
|---|---|---|---|
| Open | Pancer Donald L | $50,000 | |
| Closed | Pancer Donald L | -- | |
| Previous Owner | Pancer Donald L | $116,000 | |
| Closed | Pancer Donald L | $5,000 |
Source: Public Records
Tax History
| Year | Tax Paid | Tax Assessment Tax Assessment Total Assessment is a certain percentage of the fair market value that is determined by local assessors to be the total taxable value of land and additions on the property. | Land | Improvement |
|---|---|---|---|---|
| 2025 | $4,231 | $69,330 | $28,230 | $41,100 |
| 2024 | $4,231 | $56,750 | $15,880 | $40,870 |
| 2023 | $4,227 | $56,750 | $15,880 | $40,870 |
| 2022 | $4,126 | $51,620 | $15,880 | $35,740 |
| 2021 | $4,095 | $51,620 | $15,880 | $35,740 |
| 2020 | $3,920 | $47,500 | $13,950 | $33,550 |
| 2019 | $3,932 | $47,500 | $13,950 | $33,550 |
| 2018 | $3,812 | $44,180 | $12,220 | $31,960 |
| 2017 | $3,781 | $44,180 | $12,220 | $31,960 |
| 2016 | $3,522 | $41,540 | $12,220 | $29,320 |
Source: Public Records
Map
Nearby Homes
- 711 Mosely Ct
- 818 Mary Lee Ct
- 1230 Summit Meadows Dr
- 811 Mary Lee Ct
- 1251 Green Knoll Dr
- 800 Mary Lee Ct
- 975 Arlington Glen Dr
- 1273 Green Falls Dr
- 687 Green Forest Dr
- 1375 Mosswoods Dr
- 91 Poppy Dr Unit 91
- 63 Smoke Tree Dr
- 000 Gravois Summit
- 946 Tree Trails Ln
- 927 Gravois Rd
- 1221 Newport Landing Dr
- 1237 Trails Dr
- 1233 Newport Landing Dr
- 1360 Premio Dr
- 1590 Codorniz Ln
- 1319 Summit Dr
- 3 Misty Lou Ct
- 7 Misty Lou Ct
- 1323 Summit Dr
- 11 Misty Lou Ct
- 1318 Summit Dr
- 1324 Summit Dr
- 1327 Summit Dr
- 1301 Summit Dr
- 6 Misty Lou Ct
- 15 Misty Lou Ct
- 46 Mount Carmel Ct
- 10 Misty Lou Ct
- 1300 Summit Dr
- 1331 Summit Dr
- 50 Mount Carmel Ct
- 24 Mount Carmel Ct
- 42 Mount Carmel Ct
- 14 Misty Lou Ct
- 1001 Highland Dr
Your Personal Tour Guide
Ask me questions while you tour the home.