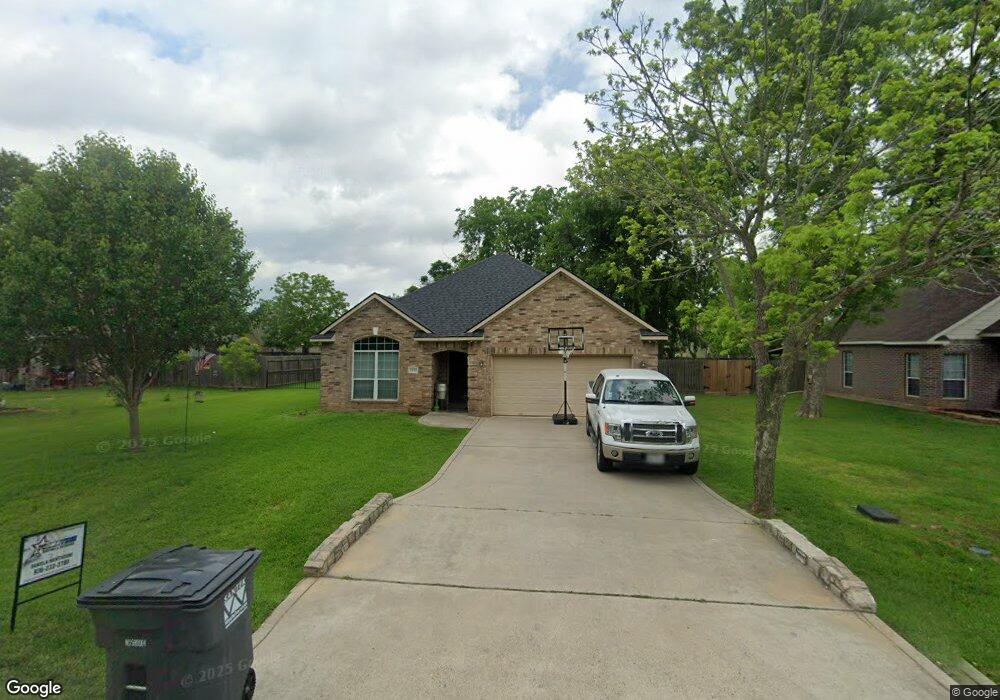
13150 Lazy Ln Unit 1 Willis, TX 77318
Lake Conroe NeighborhoodEstimated Value: $258,450 - $268,000
3
Beds
2
Baths
1,642
Sq Ft
$161/Sq Ft
Est. Value
About This Home
This home is located at 13150 Lazy Ln Unit 1, Willis, TX 77318 and is currently estimated at $265,113, approximately $161 per square foot. 13150 Lazy Ln Unit 1 is a home located in Montgomery County with nearby schools including W. Lloyd Meador Elementary School, Robert P. Brabham Middle School, and Willis High School.
Ownership History
Date
Name
Owned For
Owner Type
Purchase Details
Closed on
Dec 7, 2012
Sold by
Kutter Kyle C and Kutter Stephanie
Bought by
Corley Billie
Current Estimated Value
Home Financials for this Owner
Home Financials are based on the most recent Mortgage that was taken out on this home.
Original Mortgage
$135,500
Outstanding Balance
$93,347
Interest Rate
3.25%
Mortgage Type
FHA
Estimated Equity
$171,766
Purchase Details
Closed on
Mar 13, 2006
Sold by
L H Miller Inc
Bought by
Kutter Kyle C and Kutter Stephanie
Home Financials for this Owner
Home Financials are based on the most recent Mortgage that was taken out on this home.
Original Mortgage
$104,720
Interest Rate
6.19%
Mortgage Type
Fannie Mae Freddie Mac
Purchase Details
Closed on
Jul 2, 1996
Sold by
Owen Jimmy and Owen Debora
Bought by
Tejas Financial Corp
Purchase Details
Closed on
Dec 5, 1991
Sold by
Fimsa Southwest
Bought by
Corley Billie
Create a Home Valuation Report for This Property
The Home Valuation Report is an in-depth analysis detailing your home's value as well as a comparison with similar homes in the area
Home Values in the Area
Average Home Value in this Area
Purchase History
| Date | Buyer | Sale Price | Title Company |
|---|---|---|---|
| Corley Billie | -- | Walker County Title Company | |
| Kutter Kyle C | -- | Chicago Title Insurance Co | |
| Tejas Financial Corp | -- | -- | |
| Corley Billie | -- | -- |
Source: Public Records
Mortgage History
| Date | Status | Borrower | Loan Amount |
|---|---|---|---|
| Open | Corley Billie | $135,500 | |
| Previous Owner | Kutter Kyle C | $104,720 |
Source: Public Records
Tax History Compared to Growth
Tax History
| Year | Tax Paid | Tax Assessment Tax Assessment Total Assessment is a certain percentage of the fair market value that is determined by local assessors to be the total taxable value of land and additions on the property. | Land | Improvement |
|---|---|---|---|---|
| 2025 | $5,202 | $233,547 | $46,875 | $186,672 |
| 2024 | $5,117 | $247,116 | $29,438 | $217,678 |
| 2023 | $5,117 | $248,430 | $29,440 | $218,990 |
| 2022 | $5,516 | $248,430 | $29,440 | $218,990 |
| 2021 | $4,269 | $186,040 | $18,750 | $167,290 |
| 2020 | $4,463 | $183,340 | $18,750 | $164,590 |
| 2019 | $4,288 | $166,560 | $18,750 | $147,810 |
| 2018 | $3,950 | $153,420 | $18,750 | $134,670 |
| 2017 | $3,997 | $153,950 | $16,410 | $137,540 |
| 2016 | $3,927 | $151,270 | $7,030 | $144,240 |
| 2015 | $3,322 | $138,970 | $7,030 | $131,940 |
| 2014 | $3,322 | $126,670 | $7,030 | $119,640 |
Source: Public Records
Map
Nearby Homes
- 12375 Pecan Dr
- 12359 Pecan Dr
- 12351 Pecan Dr
- 12235 Ridgecrest Dr
- 12441 Hackberry Dr
- 13015 Moon Rd
- 13267 Lazy Ln
- 12491 Ridgecrest Dr
- 13318 Hilltop Cir
- 12357 Lake Conroe Hills Dr
- 13564 Miller Ln
- 12534 Ridgecrest Dr
- 13560 Miller Ln
- 12370 Lake Conroe Hills Dr
- 13221 Miller Ln
- 12550 Hackberry Dr
- 12384 Lake Conroe Hills Dr
- 00 Lake Conroe Hills Dr
- 12818 Sunny Pass
- 12575 Lake Conroe Hills Dr
- 13150 Lazy Ln
- 13134 Lazy Ln
- 13153 Crestview Cir
- 13159 Crestview Cir
- 13118 Lazy Ln
- 13182 Lazy Ln
- 13157 Lazy Ln
- 13141 Lazy Ln
- 13147 Crestview Cir
- 12401 Ridgecrest Dr
- 13119 Lazy Ln
- 13102 Lazy Ln
- 13198 Lazy Ln
- 13158 Crestview Cir
- 211 Butterfly Orchid Ct
- 13103 Lazy Ln
- 13199 Lazy Ln
- 12324 Greenridge Dr
- 13086 Lazy Ln
- 13087 Lazy Ln