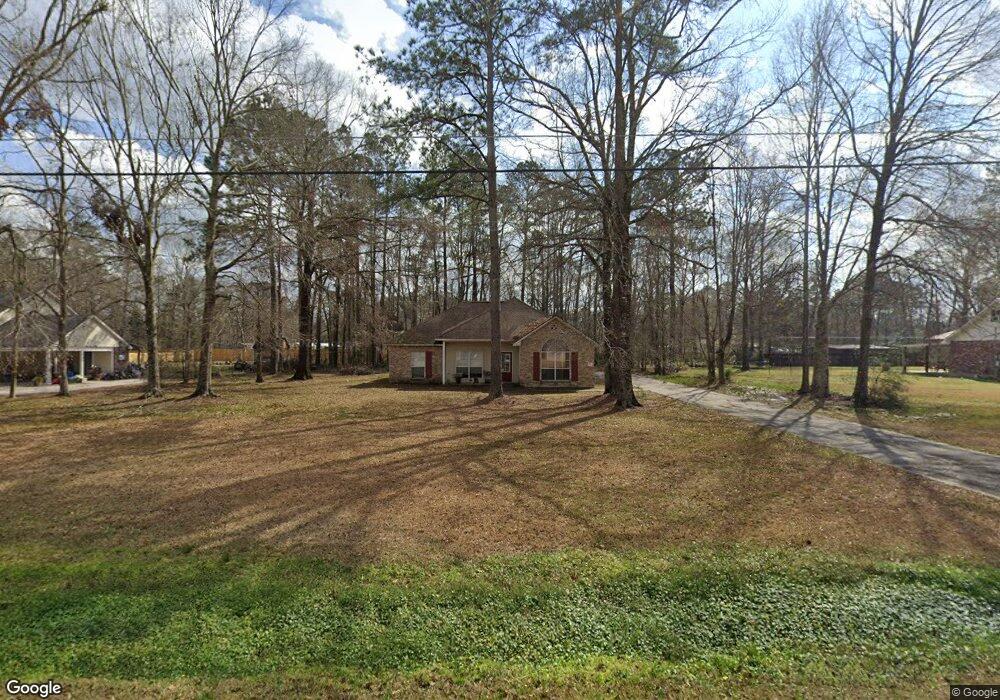
13152 Montrose Dr S Denham Springs, LA 70726
Estimated Value: $169,000 - $234,000
3
Beds
2
Baths
1,432
Sq Ft
$142/Sq Ft
Est. Value
About This Home
This home is located at 13152 Montrose Dr S, Denham Springs, LA 70726 and is currently estimated at $202,775, approximately $141 per square foot. 13152 Montrose Dr S is a home located in Livingston Parish with nearby schools including Gray's Creek Elementary School, Juban Parc Junior High School, and Denham Springs Freshman High School.
Ownership History
Date
Name
Owned For
Owner Type
Purchase Details
Closed on
Feb 29, 2024
Sold by
Taylor Jeffrey G and Taylor Delia A
Bought by
Coupel Hunter Paul
Current Estimated Value
Home Financials for this Owner
Home Financials are based on the most recent Mortgage that was taken out on this home.
Original Mortgage
$187,251
Outstanding Balance
$184,119
Interest Rate
6.6%
Mortgage Type
New Conventional
Estimated Equity
$18,656
Purchase Details
Closed on
Nov 20, 2023
Sold by
Parish Of Livingston
Bought by
Branch Banking And Trust Company and Banes
Purchase Details
Closed on
Dec 28, 2012
Sold by
Lamy George Ronald
Bought by
Banes Brian A and Banes Chantelle Evans
Home Financials for this Owner
Home Financials are based on the most recent Mortgage that was taken out on this home.
Original Mortgage
$140,409
Interest Rate
3.25%
Mortgage Type
FHA
Create a Home Valuation Report for This Property
The Home Valuation Report is an in-depth analysis detailing your home's value as well as a comparison with similar homes in the area
Home Values in the Area
Average Home Value in this Area
Purchase History
| Date | Buyer | Sale Price | Title Company |
|---|---|---|---|
| Coupel Hunter Paul | $139,357 | None Listed On Document | |
| Branch Banking And Trust Company | $138,500 | None Listed On Document | |
| Banes Brian A | $143,000 | Professional Title Of La Inc |
Source: Public Records
Mortgage History
| Date | Status | Borrower | Loan Amount |
|---|---|---|---|
| Open | Coupel Hunter Paul | $187,251 | |
| Previous Owner | Banes Brian A | $140,409 |
Source: Public Records
Tax History Compared to Growth
Tax History
| Year | Tax Paid | Tax Assessment Tax Assessment Total Assessment is a certain percentage of the fair market value that is determined by local assessors to be the total taxable value of land and additions on the property. | Land | Improvement |
|---|---|---|---|---|
| 2024 | $2,073 | $20,253 | $2,240 | $18,013 |
| 2023 | $1,689 | $14,950 | $2,240 | $12,710 |
| 2022 | $1,701 | $14,950 | $2,240 | $12,710 |
| 2021 | $1,483 | $14,950 | $2,240 | $12,710 |
| 2020 | $1,474 | $14,950 | $2,240 | $12,710 |
| 2019 | $1,536 | $15,210 | $2,240 | $12,970 |
| 2018 | $1,558 | $15,210 | $2,240 | $12,970 |
| 2017 | $1,551 | $15,210 | $2,240 | $12,970 |
| 2015 | $727 | $14,510 | $2,240 | $12,270 |
| 2014 | $739 | $14,510 | $2,240 | $12,270 |
Source: Public Records
Map
Nearby Homes
- 13177 Montrose Dr S
- 21410 La Hwy 16
- 31460 La Hwy 16
- 13231 Hammack Rd
- SC-1-A & B Hammack Rd
- 21255 Walker Rd S Unit 27
- 22490 Bedford Dr
- 13821 Cantebury Ave
- 22753 Balsam Dr
- 13042 Vermillion Dr
- 22765 Lafourche Ln
- 14253 Oakwood Ln
- 13718 Willowmore Dr
- 13015 Calcasieu Dr
- 13064 Catahoula Dr
- 22807 Lafourche Ln
- 13023 Catahoula Dr
- 12452 Preakness Dr
- 12421 Preakness Dr
- 12427 Preakness Dr
- 13152 Montrose South Dr
- 13158 Montrose South Dr
- 13158 S Montrose Ave
- 13158 Montrose South Dr
- 13146 Montrose South Dr
- 13153 Montrose South Dr
- 13149 Montrose South Dr
- 13153 Montrose Dr S
- 13153 Montrose Dr S
- 13157 Montrose Dr S
- 13231 Ed Dr
- 13149 Montrose Dr S
- 13164 Montrose Dr S
- 13241 Ed Dr
- 13157 Montrose South Dr
- 13145 Montrose South Dr
- 13145 Montrose Dr S
- 13191 Ed Dr
- 13161 Montrose South Dr
- 13161 Montrose Dr S