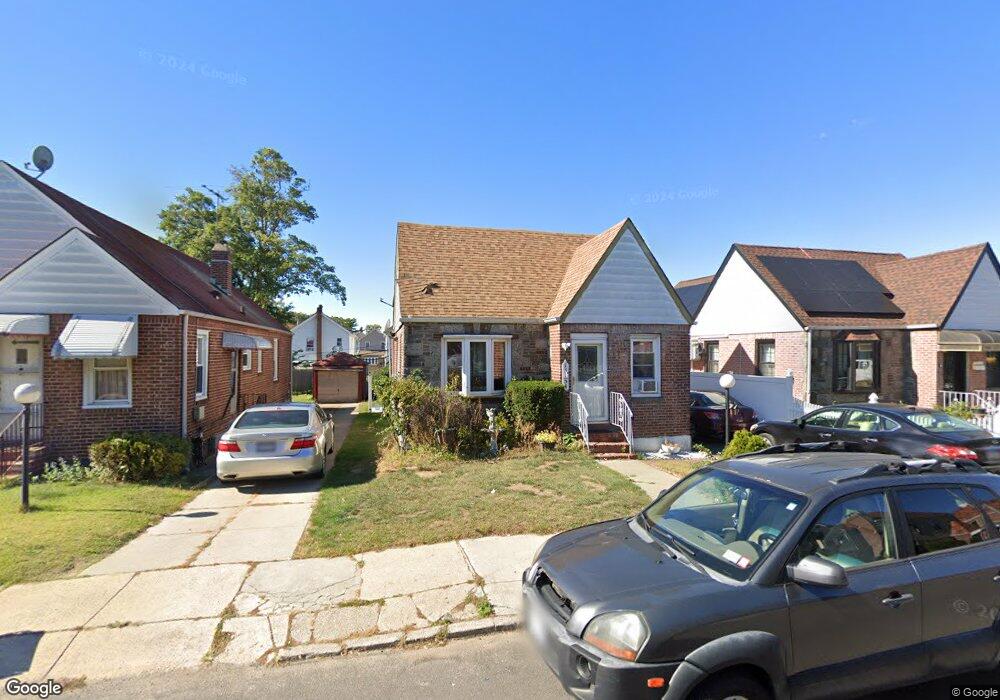
13154 224th St Springfield Gardens, NY 11413
Laurelton NeighborhoodEstimated Value: $615,000 - $803,000
--
Bed
--
Bath
1,458
Sq Ft
$485/Sq Ft
Est. Value
About This Home
This home is located at 13154 224th St, Springfield Gardens, NY 11413 and is currently estimated at $707,220, approximately $485 per square foot. 13154 224th St is a home located in Queens County with nearby schools including P.S. 132 - Ralph Bunche, Is 59 Springfield Gardens, and Success Academy Springfield Gardens.
Ownership History
Date
Name
Owned For
Owner Type
Purchase Details
Closed on
Jun 10, 2004
Sold by
Q & D Town Corp
Bought by
Snead Paulette
Current Estimated Value
Home Financials for this Owner
Home Financials are based on the most recent Mortgage that was taken out on this home.
Original Mortgage
$283,500
Interest Rate
6.32%
Mortgage Type
Purchase Money Mortgage
Purchase Details
Closed on
Jan 10, 2003
Sold by
Chythia H Reiss Esq As Referee
Bought by
Q & D Town Corp
Purchase Details
Closed on
Jul 11, 2000
Sold by
Golyn Homes Inc
Bought by
Satchell Sylbert
Home Financials for this Owner
Home Financials are based on the most recent Mortgage that was taken out on this home.
Original Mortgage
$193,030
Interest Rate
8.1%
Purchase Details
Closed on
Nov 29, 1993
Sold by
Trepel Mindy J
Bought by
Nice Properties Inc
Create a Home Valuation Report for This Property
The Home Valuation Report is an in-depth analysis detailing your home's value as well as a comparison with similar homes in the area
Home Values in the Area
Average Home Value in this Area
Purchase History
| Date | Buyer | Sale Price | Title Company |
|---|---|---|---|
| Snead Paulette | $315,000 | -- | |
| Snead Paulette | $315,000 | -- | |
| Q & D Town Corp | $201,000 | -- | |
| Q & D Town Corp | $201,000 | -- | |
| Satchell Sylbert | $199,000 | Stewart Title | |
| Golyn Homes Inc | $130,000 | Stewart Title | |
| Golyn Homes Inc | $130,000 | Stewart Title | |
| Nice Properties Inc | -- | -- | |
| Nice Properties Inc | -- | -- |
Source: Public Records
Mortgage History
| Date | Status | Borrower | Loan Amount |
|---|---|---|---|
| Open | Snead Paulette | $15,750 | |
| Closed | Snead Paulette | $15,750 | |
| Previous Owner | Snead Paulette | $283,500 | |
| Previous Owner | Golyn Homes Inc | $193,030 | |
| Previous Owner | Golyn Homes Inc | $0 |
Source: Public Records
Tax History Compared to Growth
Tax History
| Year | Tax Paid | Tax Assessment Tax Assessment Total Assessment is a certain percentage of the fair market value that is determined by local assessors to be the total taxable value of land and additions on the property. | Land | Improvement |
|---|---|---|---|---|
| 2025 | $5,987 | $29,860 | $7,719 | $22,141 |
| 2024 | $5,987 | $29,808 | $9,195 | $20,613 |
| 2023 | $5,952 | $29,632 | $8,588 | $21,044 |
| 2022 | $5,581 | $36,420 | $10,920 | $25,500 |
| 2021 | $5,551 | $33,840 | $10,920 | $22,920 |
| 2020 | $5,267 | $29,580 | $10,920 | $18,660 |
| 2019 | $5,196 | $27,960 | $10,920 | $17,040 |
| 2018 | $5,034 | $24,693 | $10,829 | $13,864 |
| 2017 | $4,749 | $23,296 | $10,241 | $13,055 |
| 2016 | $4,394 | $23,296 | $10,241 | $13,055 |
| 2015 | $2,651 | $20,736 | $10,419 | $10,317 |
| 2014 | $2,651 | $20,700 | $12,120 | $8,580 |
Source: Public Records
Map
Nearby Homes
- 131-35 222nd St
- 131-20 224th St
- 22310 131st Ave
- 133-23 225th St
- 131-41 226th St Unit 60
- 131-18 226th St
- 133-22 226th St
- 13062 225th St
- 133-15 220th St
- 130-43 224th St
- 130-55 222nd St
- 21931 133rd Ave
- 134-15 221st St
- 21917 132nd Rd
- 134-16 221st St
- 130-45 220th St
- 223-12 134th Rd
- 220-27 134th Rd
- 22126 134th Rd
- 13069 227th St