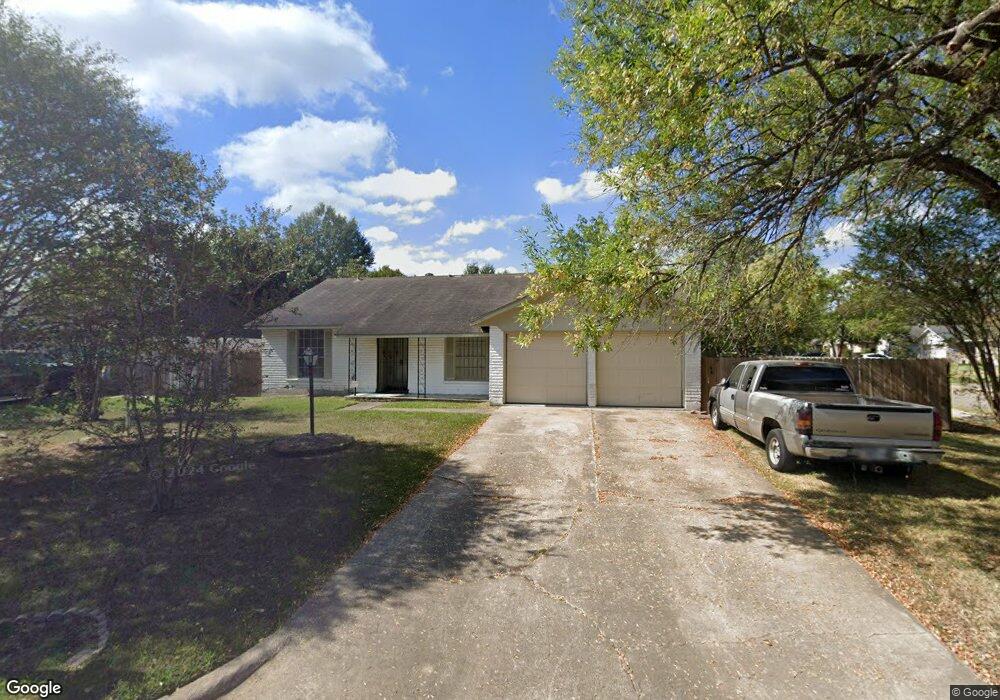
13155 Winding Wood Dr Houston, TX 77038
North Houston NeighborhoodEstimated Value: $212,748 - $238,000
3
Beds
4
Baths
1,518
Sq Ft
$149/Sq Ft
Est. Value
About This Home
This home is located at 13155 Winding Wood Dr, Houston, TX 77038 and is currently estimated at $225,937, approximately $148 per square foot. 13155 Winding Wood Dr is a home located in Harris County with nearby schools including Gloria B. Sammons Elementary School, Stovall School, and Dr. Viola K. Garcia Middle School.
Ownership History
Date
Name
Owned For
Owner Type
Purchase Details
Closed on
Nov 6, 2012
Sold by
Bank Of New York Mellon Trust Co Na
Bought by
Grewal Simarpal and Grewal Jaswinder
Current Estimated Value
Purchase Details
Closed on
Jul 12, 2012
Sold by
Castillo Tomas S
Bought by
The Bank Of New York Mellon Trust Co Na and The Bank Of New York Trust Co Na
Purchase Details
Closed on
Jun 27, 2012
Sold by
Castillo Tomas S
Bought by
Bank Of New York Mellon Trust Company Na
Purchase Details
Closed on
Nov 8, 2004
Sold by
Freewill Baptist Church
Bought by
Castillo Tomas S
Home Financials for this Owner
Home Financials are based on the most recent Mortgage that was taken out on this home.
Original Mortgage
$103,000
Interest Rate
8.25%
Mortgage Type
Purchase Money Mortgage
Create a Home Valuation Report for This Property
The Home Valuation Report is an in-depth analysis detailing your home's value as well as a comparison with similar homes in the area
Home Values in the Area
Average Home Value in this Area
Purchase History
| Date | Buyer | Sale Price | Title Company |
|---|---|---|---|
| Grewal Simarpal | -- | Lsi Title Agency Inc | |
| The Bank Of New York Mellon Trust Co Na | -- | None Available | |
| Bank Of New York Mellon Trust Company Na | $50,992 | None Available | |
| Castillo Tomas S | -- | American Title Co |
Source: Public Records
Mortgage History
| Date | Status | Borrower | Loan Amount |
|---|---|---|---|
| Previous Owner | Castillo Tomas S | $103,000 |
Source: Public Records
Tax History Compared to Growth
Tax History
| Year | Tax Paid | Tax Assessment Tax Assessment Total Assessment is a certain percentage of the fair market value that is determined by local assessors to be the total taxable value of land and additions on the property. | Land | Improvement |
|---|---|---|---|---|
| 2025 | $4,592 | $186,330 | $37,418 | $148,912 |
| 2024 | $4,592 | $174,605 | $37,418 | $137,187 |
| 2023 | $4,592 | $184,780 | $37,418 | $147,362 |
| 2022 | $4,529 | $153,691 | $37,418 | $116,273 |
| 2021 | $4,015 | $140,850 | $22,451 | $118,399 |
| 2020 | $4,256 | $140,850 | $22,451 | $118,399 |
| 2019 | $3,976 | $126,870 | $22,451 | $104,419 |
| 2018 | $3,573 | $115,957 | $22,451 | $93,506 |
| 2017 | $3,736 | $121,438 | $22,451 | $98,987 |
| 2016 | $3,036 | $98,685 | $22,451 | $76,234 |
| 2015 | $1,902 | $100,127 | $22,451 | $77,676 |
| 2014 | $1,902 | $60,000 | $14,967 | $45,033 |
Source: Public Records
Map
Nearby Homes
- 2614 Lemonwood Ln
- 2203 Chalet Rd
- 2530 Woodtown Dr
- 2719 Magnolia Hill Trail
- 2115 Havencrest Dr
- 00 Fallbrook Dr
- 0 W Mt Houston Rd Unit 90464120
- 2811 Oakland Brook St
- 2831 Oakland Brook St
- 2835 Oakland Brook St
- 2838 Packard Elm St
- 1327 Fallbrook Dr
- 12718 Sai Baba Dr
- 1219 Pilot Point Dr
- 10519 Pleasanton Dr
- 1506 Wilshire Park Dr
- 10558 Pleasanton Dr
- 1138 Cherry Spring Dr
- Whitetail Plan at Forestwood
- Kitson Plan at Forestwood
- 13151 Winding Wood Dr
- 13138 Woodington Dr
- 13134 Woodington Dr
- 13147 Winding Wood Dr
- 2402 Woodsdale Blvd
- 13130 Woodington Dr
- 2406 Woodsdale Blvd
- 13154 Winding Wood Dr
- 13150 Winding Wood Dr
- 13143 Winding Wood Dr
- 2410 Woodsdale Blvd
- 13146 Winding Wood Dr
- 13126 Woodington Dr
- 13202 Winding Wood Dr
- 2414 Woodsdale Blvd
- 13124 Woodington Dr
- 13139 Winding Wood Dr
- 13122 Woodington Dr
- 13206 Winding Wood Dr
- 13142 Winding Wood Dr