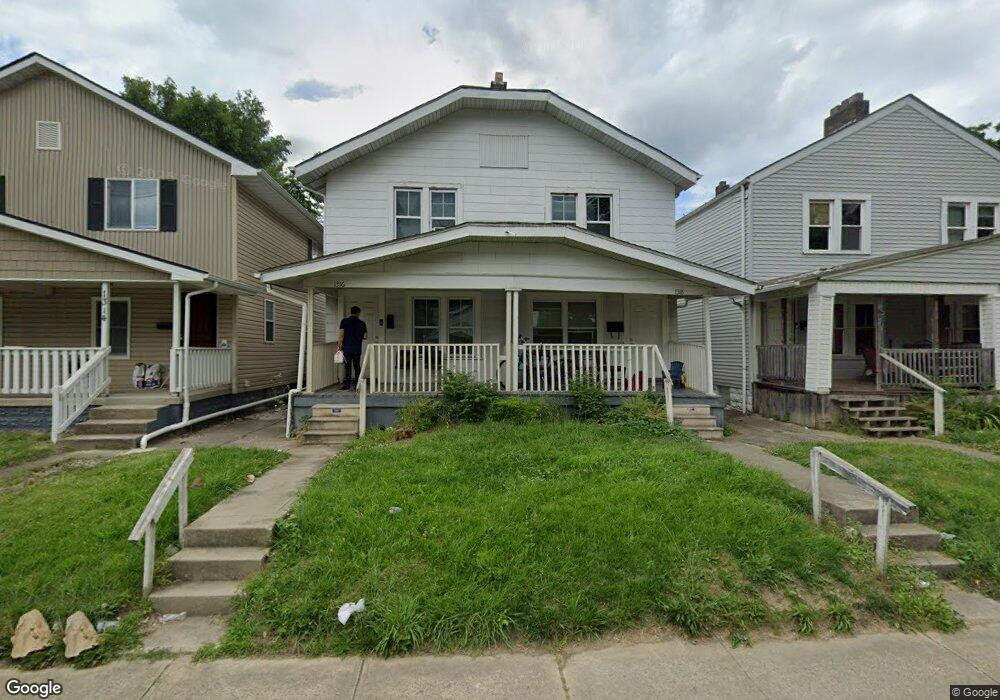
1316-1318 E 17th Ave Unit 318 Columbus, OH 43211
South Linden NeighborhoodEstimated Value: $163,252 - $220,000
6
Beds
2
Baths
2,240
Sq Ft
$87/Sq Ft
Est. Value
About This Home
This home is located at 1316-1318 E 17th Ave Unit 318, Columbus, OH 43211 and is currently estimated at $195,813, approximately $87 per square foot. 1316-1318 E 17th Ave Unit 318 is a home located in Franklin County with nearby schools including Windsor Stem Acadmey, Linden-Mckinley Stem School On Arcadia, and North Columbus Preparatory Academy.
Ownership History
Date
Name
Owned For
Owner Type
Purchase Details
Closed on
Aug 31, 2009
Sold by
Investment Property Source 2 Tag Llc
Bought by
Tag Real Estate Llc
Current Estimated Value
Purchase Details
Closed on
Apr 8, 2009
Sold by
Hoehn Joe
Bought by
Investment Property Source 2 Tag Llc
Purchase Details
Closed on
May 7, 2008
Sold by
Newland Larry J and Leonard Edward
Bought by
Hoehn Joe
Purchase Details
Closed on
May 19, 1999
Sold by
Webber William L and Webber Alison J
Bought by
Newland Larry J
Home Financials for this Owner
Home Financials are based on the most recent Mortgage that was taken out on this home.
Original Mortgage
$10,500
Interest Rate
6.99%
Mortgage Type
Seller Take Back
Purchase Details
Closed on
Dec 15, 1972
Bought by
Webber William L
Create a Home Valuation Report for This Property
The Home Valuation Report is an in-depth analysis detailing your home's value as well as a comparison with similar homes in the area
Home Values in the Area
Average Home Value in this Area
Purchase History
| Date | Buyer | Sale Price | Title Company |
|---|---|---|---|
| Tag Real Estate Llc | -- | Northwest T | |
| Investment Property Source 2 Tag Llc | $7,000 | Northwest T | |
| Hoehn Joe | $3,800 | Investors F | |
| Newland Larry J | $20,500 | Liberty Title & Escrow Inc | |
| Webber William L | -- | -- |
Source: Public Records
Mortgage History
| Date | Status | Borrower | Loan Amount |
|---|---|---|---|
| Previous Owner | Newland Larry J | $10,500 |
Source: Public Records
Tax History Compared to Growth
Tax History
| Year | Tax Paid | Tax Assessment Tax Assessment Total Assessment is a certain percentage of the fair market value that is determined by local assessors to be the total taxable value of land and additions on the property. | Land | Improvement |
|---|---|---|---|---|
| 2024 | $2,118 | $46,210 | $5,920 | $40,290 |
| 2023 | $2,091 | $46,200 | $5,915 | $40,285 |
| 2022 | $1,135 | $21,350 | $2,450 | $18,900 |
| 2021 | $1,137 | $21,350 | $2,450 | $18,900 |
| 2020 | $1,138 | $21,350 | $2,450 | $18,900 |
| 2019 | $1,106 | $17,780 | $2,030 | $15,750 |
| 2018 | $1,070 | $17,780 | $2,030 | $15,750 |
| 2017 | $1,105 | $17,780 | $2,030 | $15,750 |
| 2016 | $1,137 | $16,740 | $2,350 | $14,390 |
| 2015 | $1,035 | $16,740 | $2,350 | $14,390 |
| 2014 | $1,038 | $16,740 | $2,350 | $14,390 |
| 2013 | $569 | $18,585 | $2,590 | $15,995 |
Source: Public Records
Map
Nearby Homes
- 1366 E 17th Ave Unit 368
- 1369-1371 E 18th Ave
- 1316 E 16th Ave
- 1292 E 17th Ave
- 1411 E 18th Ave
- 1273-1275 E 18th Ave
- 1287 E 19th Ave
- 1288-1292 E 19th Ave
- 1249-1251 E 15th Ave
- 1661 Cleveland Ave Unit 1659
- 0 Windsor Ave
- 1386 E 22nd Ave
- 1371 E 23rd Ave
- 1094 E 16th Ave
- 1384 E 23rd Ave
- 1121 Windsor Ave
- 1082-1084 E 17th Ave
- 1326 E 23rd Ave
- 1109 Windsor Ave Unit 1103
- 1111 Windsor Ave
- 1316 E 17th Ave Unit 318
- 1320 E 17th Ave Unit 322
- 1320-1322 E 17th Ave
- 1320-1322 E 17th Ave Unit 322
- 1312-1314 E 17th Ave
- 1308-1310 E 17th Ave
- 1322 E 17th Ave
- 1326 E 17th Ave
- 1308 E 17th Ave Unit 310
- 1332 E 17th Ave
- 1336 E 17th Ave
- 1294 E 17th Ave
- 1317 E 17th Ave Unit 319
- 1325 E 18th Ave Unit 327
- 1329 E 18th Ave Unit 331
- 1321 E 18th Ave Unit 323
- 1340 E 17th Ave
- 1329-1331 E 18th Ave
- 1333 E 18th Ave Unit 335
- 1333-1335 E 18th Ave