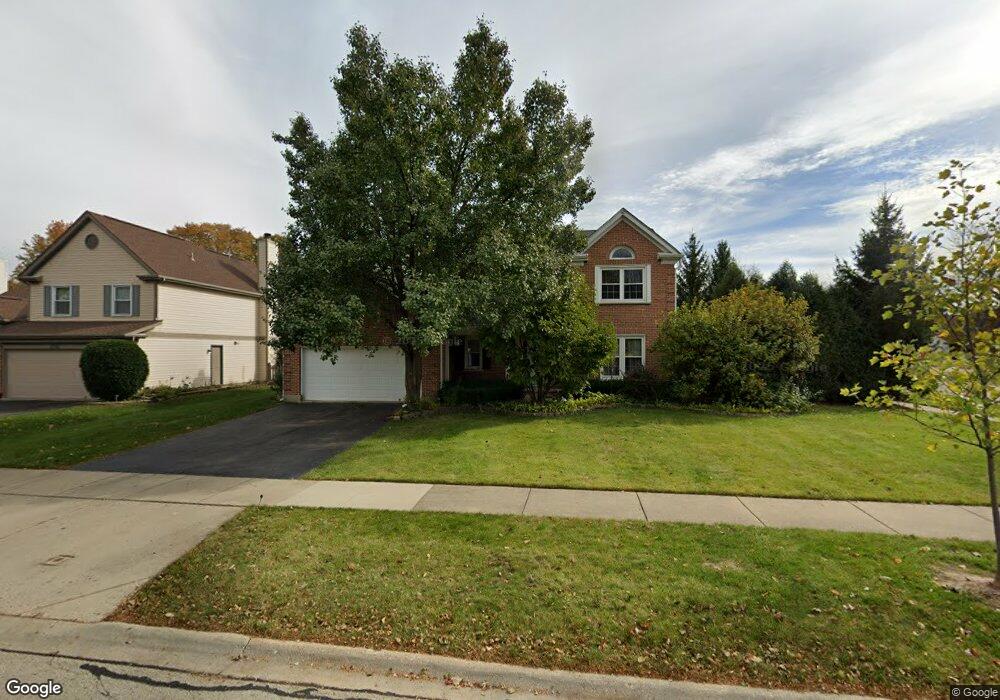
1316 Berkley Ct Buffalo Grove, IL 60089
Estimated Value: $595,000 - $680,000
--
Bed
3
Baths
2,050
Sq Ft
$310/Sq Ft
Est. Value
About This Home
This home is located at 1316 Berkley Ct, Buffalo Grove, IL 60089 and is currently estimated at $634,884, approximately $309 per square foot. 1316 Berkley Ct is a home located in Lake County with nearby schools including Meridian Middle School, Tripp Elementary School, and Aptakisic Junior High School.
Ownership History
Date
Name
Owned For
Owner Type
Purchase Details
Closed on
Aug 1, 2003
Sold by
Kistner Remo H
Bought by
Bhattaram Srinivasulu and Bhattaram Subhavijay V
Current Estimated Value
Home Financials for this Owner
Home Financials are based on the most recent Mortgage that was taken out on this home.
Original Mortgage
$316,000
Outstanding Balance
$125,217
Interest Rate
4.25%
Mortgage Type
Purchase Money Mortgage
Estimated Equity
$509,667
Purchase Details
Closed on
Jul 27, 2001
Sold by
Drake John G and Drake Kristen
Bought by
Kistner Remo H
Home Financials for this Owner
Home Financials are based on the most recent Mortgage that was taken out on this home.
Original Mortgage
$210,000
Interest Rate
6.87%
Purchase Details
Closed on
Jan 20, 2000
Sold by
Levy Michael and Levy Anna
Bought by
Drake John G and Drake Kristen
Home Financials for this Owner
Home Financials are based on the most recent Mortgage that was taken out on this home.
Original Mortgage
$220,100
Interest Rate
8.16%
Create a Home Valuation Report for This Property
The Home Valuation Report is an in-depth analysis detailing your home's value as well as a comparison with similar homes in the area
Home Values in the Area
Average Home Value in this Area
Purchase History
| Date | Buyer | Sale Price | Title Company |
|---|---|---|---|
| Bhattaram Srinivasulu | $396,000 | Rtc | |
| Kistner Remo H | $328,000 | -- | |
| Drake John G | $293,500 | -- |
Source: Public Records
Mortgage History
| Date | Status | Borrower | Loan Amount |
|---|---|---|---|
| Open | Bhattaram Srinivasulu | $316,000 | |
| Previous Owner | Kistner Remo H | $210,000 | |
| Previous Owner | Drake John G | $220,100 | |
| Closed | Drake John G | $53,350 |
Source: Public Records
Tax History Compared to Growth
Tax History
| Year | Tax Paid | Tax Assessment Tax Assessment Total Assessment is a certain percentage of the fair market value that is determined by local assessors to be the total taxable value of land and additions on the property. | Land | Improvement |
|---|---|---|---|---|
| 2024 | $16,833 | $176,746 | $45,013 | $131,733 |
| 2023 | $13,731 | $160,358 | $40,839 | $119,519 |
| 2022 | $13,731 | $146,546 | $37,321 | $109,225 |
| 2021 | $13,244 | $144,966 | $36,919 | $108,047 |
| 2020 | $12,986 | $145,461 | $37,045 | $108,416 |
| 2019 | $12,643 | $144,924 | $36,908 | $108,016 |
| 2018 | $13,252 | $151,353 | $40,120 | $111,233 |
| 2017 | $13,080 | $147,821 | $39,184 | $108,637 |
| 2016 | $12,691 | $142,250 | $37,522 | $104,728 |
| 2015 | $12,442 | $133,031 | $35,090 | $97,941 |
| 2014 | $11,277 | $119,845 | $37,687 | $82,158 |
| 2012 | $11,162 | $120,086 | $37,763 | $82,323 |
Source: Public Records
Map
Nearby Homes
- 15 Thompson Ct
- 1272 Sandhurst Dr
- 148 White Branch Ct
- 1012 Hobson Dr
- 1113 Lockwood Dr
- 938 Hidden Lake Dr
- 1118 Larraway Dr
- 538 Lasalle Ct
- 1157 Russellwood Ct
- 60 E Fabish Dr
- 51 W Fabish Dr
- 22118 N Prairie Rd
- 381 Bentley Place
- 327 Lasalle Ln
- 16202 W Aptakisic Rd
- 268 Hoffmann Dr
- 720 Dunhill Dr
- 361 Hoffmann Dr
- 2033 Olive Hill Dr
- 12 Aberdeen Ct
- 1326 Berkley Ct
- 1382 Crossfield Ct
- 1336 Berkley Ct
- 1372 Crossfield Ct
- 65 Thompson Ct
- 1406 Berkley Ct
- 1295 Euclid Ct
- 1396 Berkley Ct
- 1362 Crossfield Ct
- 1346 Berkley Ct
- 55 Thompson Ct
- 1285 Euclid Ct
- 1352 Crossfield Ct
- 161 Copperwood Dr
- 1356 Berkley Ct
- 157 Copperwood Dr
- 1366 Berkley Ct
- 25 Thompson Ct
- 45 Thompson Ct
- 1275 Euclid Ct