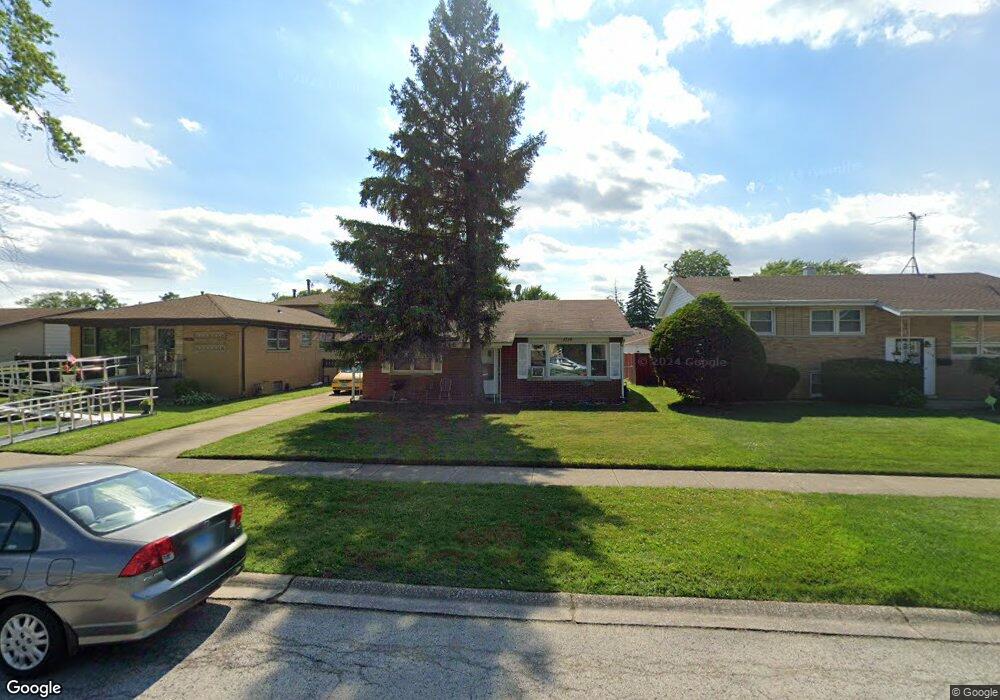
1316 Buffalo Ave Calumet City, IL 60409
Estimated Value: $157,000 - $193,000
3
Beds
2
Baths
1,020
Sq Ft
$166/Sq Ft
Est. Value
About This Home
This home is located at 1316 Buffalo Ave, Calumet City, IL 60409 and is currently estimated at $169,116, approximately $165 per square foot. 1316 Buffalo Ave is a home located in Cook County with nearby schools including Hoover Elementary School, Schrum Memorial Middle School, and Thornton Fractional North High School.
Ownership History
Date
Name
Owned For
Owner Type
Purchase Details
Closed on
Nov 3, 2013
Sold by
Bmr Properties Llc
Bought by
Bmr Properties Llc
Current Estimated Value
Purchase Details
Closed on
May 25, 2010
Sold by
Deutsche Bank National Trust Company
Bought by
Bmr Properties Llc
Purchase Details
Closed on
Jun 16, 2009
Sold by
Dunmore Henry D
Bought by
Deutsche Bank National Trust
Purchase Details
Closed on
Nov 26, 2003
Sold by
Parker Sylvia V
Bought by
Dunmore Henry D and Dunmore Vonetta L
Home Financials for this Owner
Home Financials are based on the most recent Mortgage that was taken out on this home.
Original Mortgage
$106,400
Interest Rate
7.5%
Mortgage Type
Unknown
Purchase Details
Closed on
Aug 8, 2003
Sold by
Parker Clyde E
Bought by
Parker Sylvia V
Create a Home Valuation Report for This Property
The Home Valuation Report is an in-depth analysis detailing your home's value as well as a comparison with similar homes in the area
Home Values in the Area
Average Home Value in this Area
Purchase History
| Date | Buyer | Sale Price | Title Company |
|---|---|---|---|
| Bmr Properties Llc | -- | None Available | |
| Bmr Properties Llc | $26,000 | First American | |
| Deutsche Bank National Trust | -- | None Available | |
| Dunmore Henry D | $112,000 | Atgf Inc | |
| Parker Sylvia V | -- | -- |
Source: Public Records
Mortgage History
| Date | Status | Borrower | Loan Amount |
|---|---|---|---|
| Previous Owner | Dunmore Henry D | $106,400 |
Source: Public Records
Tax History Compared to Growth
Tax History
| Year | Tax Paid | Tax Assessment Tax Assessment Total Assessment is a certain percentage of the fair market value that is determined by local assessors to be the total taxable value of land and additions on the property. | Land | Improvement |
|---|---|---|---|---|
| 2024 | $8,786 | $11,904 | $2,529 | $9,375 |
| 2023 | $7,912 | $14,000 | $2,529 | $11,471 |
| 2022 | $7,912 | $9,280 | $2,231 | $7,049 |
| 2021 | $8,107 | $9,690 | $2,231 | $7,459 |
| 2020 | $6,848 | $9,690 | $2,231 | $7,459 |
| 2019 | $5,582 | $7,508 | $2,082 | $5,426 |
| 2018 | $5,617 | $7,508 | $2,082 | $5,426 |
| 2017 | $5,335 | $7,508 | $2,082 | $5,426 |
| 2016 | $5,470 | $8,116 | $1,933 | $6,183 |
| 2015 | $5,388 | $8,116 | $1,933 | $6,183 |
| 2014 | $5,182 | $8,116 | $1,933 | $6,183 |
| 2013 | $5,487 | $9,289 | $1,933 | $7,356 |
Source: Public Records
Map
Nearby Homes
- 1317 Mackinaw Ave
- 1365 Imperial Ave
- 1367 Buffalo Ave
- 1287 Arthur St
- 1295 Greenbay Ave
- 1262 Greenbay Ave
- 1272 Burnham Ave
- 1253 Arthur St
- 1383 Greenbay Ave
- 1261 Balmoral Ave
- 1290 Balmoral Ave
- 1354 Hirsch Ave
- 1278 Balmoral Ave
- 1229 Arthur St
- 826 Williams St
- 1404 Burnham Ave
- 1295 Hirsch Ave
- 836 Williams St
- 916 William St
- 1366 Price Ave
- 1310 Buffalo Ave
- 1320 Buffalo Ave
- 1308 Buffalo Ave
- 1324 Buffalo Ave
- 1315 Superior Ave
- 1311 Superior Ave
- 1319 Superior Ave
- 1304 Buffalo Ave
- 1328 Buffalo Ave
- 1307 Superior Ave
- 1323 Superior Ave
- 1317 Buffalo Ave
- 1311 Buffalo Ave
- 1321 Buffalo Ave
- 1300 Buffalo Ave
- 1332 Buffalo Ave
- 1303 Superior Ave
- 1327 Superior Ave
- 1309 Buffalo Ave
- 1325 Buffalo Ave