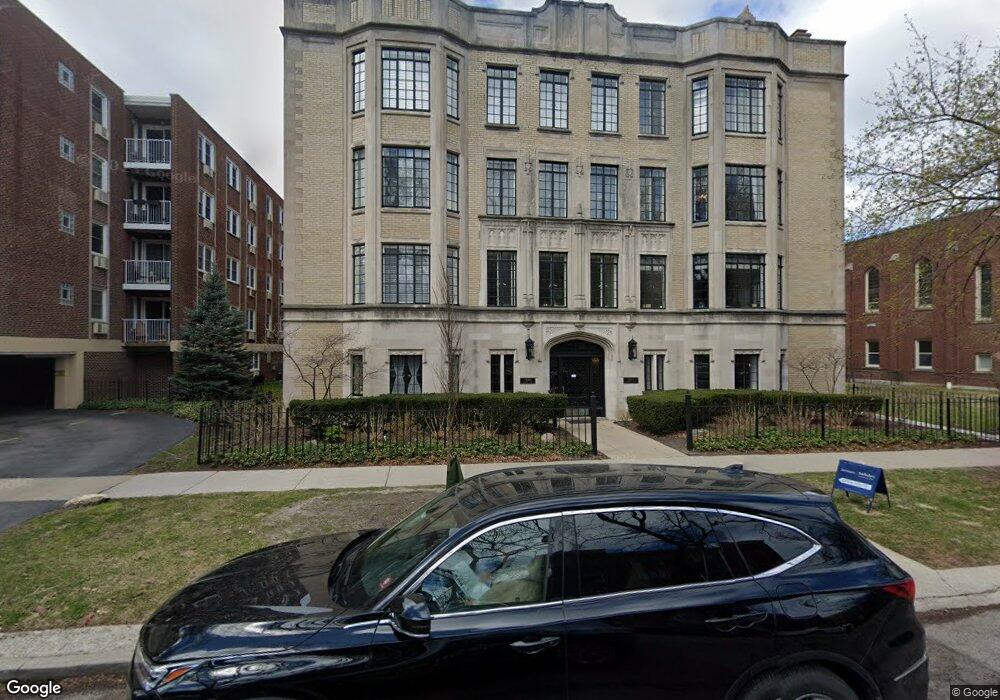
1316 Maple Ave Unit C2 Evanston, IL 60201
Southeast Evanston NeighborhoodEstimated Value: $321,000 - $621,000
2
Beds
--
Bath
34,924
Sq Ft
$14/Sq Ft
Est. Value
About This Home
This home is located at 1316 Maple Ave Unit C2, Evanston, IL 60201 and is currently estimated at $477,754, approximately $13 per square foot. 1316 Maple Ave Unit C2 is a home located in Cook County with nearby schools including Dewey Elementary School, Washington Elementary School, and Nichols Middle School.
Ownership History
Date
Name
Owned For
Owner Type
Purchase Details
Closed on
Dec 13, 2007
Sold by
Siman Shelley
Bought by
Thombre Milind
Current Estimated Value
Purchase Details
Closed on
Apr 30, 2001
Sold by
Nichols Mcconner Casilda K and Nichols Casilda K
Bought by
Thombre Milind and Siman Shelley
Home Financials for this Owner
Home Financials are based on the most recent Mortgage that was taken out on this home.
Original Mortgage
$236,700
Interest Rate
7.02%
Create a Home Valuation Report for This Property
The Home Valuation Report is an in-depth analysis detailing your home's value as well as a comparison with similar homes in the area
Home Values in the Area
Average Home Value in this Area
Purchase History
| Date | Buyer | Sale Price | Title Company |
|---|---|---|---|
| Thombre Milind | -- | None Available | |
| Thombre Milind | $263,000 | -- |
Source: Public Records
Mortgage History
| Date | Status | Borrower | Loan Amount |
|---|---|---|---|
| Previous Owner | Thombre Milind | $236,700 |
Source: Public Records
Tax History
| Year | Tax Paid | Tax Assessment Tax Assessment Total Assessment is a certain percentage of the fair market value that is determined by local assessors to be the total taxable value of land and additions on the property. | Land | Improvement |
|---|---|---|---|---|
| 2025 | $8,358 | $38,089 | $1,627 | $36,462 |
| 2024 | $8,358 | $37,839 | $1,377 | $36,462 |
| 2023 | $7,995 | $37,839 | $1,377 | $36,462 |
| 2022 | $7,995 | $37,839 | $1,377 | $36,462 |
| 2021 | $3,904 | $18,040 | $907 | $17,133 |
| 2020 | $3,911 | $18,040 | $907 | $17,133 |
| 2019 | $3,887 | $20,020 | $907 | $19,113 |
| 2018 | $5,015 | $21,740 | $750 | $20,990 |
| 2017 | $4,900 | $21,740 | $750 | $20,990 |
| 2016 | $4,870 | $21,740 | $750 | $20,990 |
| 2015 | $4,234 | $18,414 | $610 | $17,804 |
| 2014 | $4,208 | $18,414 | $610 | $17,804 |
| 2013 | $4,096 | $18,414 | $610 | $17,804 |
Source: Public Records
Map
Nearby Homes
- 1310 Maple Ave Unit 5C
- 1323 Maple Ave Unit 3NE
- 1414 Elmwood Ave Unit 3F
- 1235 Ridge Ave
- 1218 Elmwood Ave
- 1232 Ridge Ave
- 1315 Asbury Ave Unit 5
- 1236 Chicago Ave Unit D403
- 1415 Sherman Ave Unit 506
- 1570 Elmwood Ave Unit 802
- 1570 Elmwood Ave Unit 1111
- 1122 Sherman Ave
- 516 Greenwood St
- 1567 Ridge Ave Unit 408
- 1580 Sherman Ave Unit 906
- 1585 Ridge Ave Unit 506
- 1585 Ridge Ave Unit 502
- 1585 Ridge Ave Unit 404
- 1585 Ridge Ave Unit 608
- 1585 Ridge Ave Unit 611
- 1316 Maple Ave Unit B1
- 1316 Maple Ave Unit G6
- 1316 Maple Ave Unit G5
- 1316 Maple Ave Unit L4
- 1316 Maple Ave Unit C3
- 1316 Maple Ave Unit G3
- 1316 Maple Ave Unit G2
- 1316 Maple Ave Unit G1
- 1316 Maple Ave Unit G8
- 1316 Maple Ave Unit G4
- 1316 Maple Ave Unit D1
- 1316 Maple Ave Unit F1
- 1316 Maple Ave Unit L1
- 1316 Maple Ave Unit D2
- 1316 Maple Ave Unit L2
- 1316 Maple Ave Unit E3
- 1316 Maple Ave Unit F3
- 1316 Maple Ave Unit G7
- 1316 Maple Ave Unit A2
- 1316 Maple Ave Unit F2
Your Personal Tour Guide
Ask me questions while you tour the home.