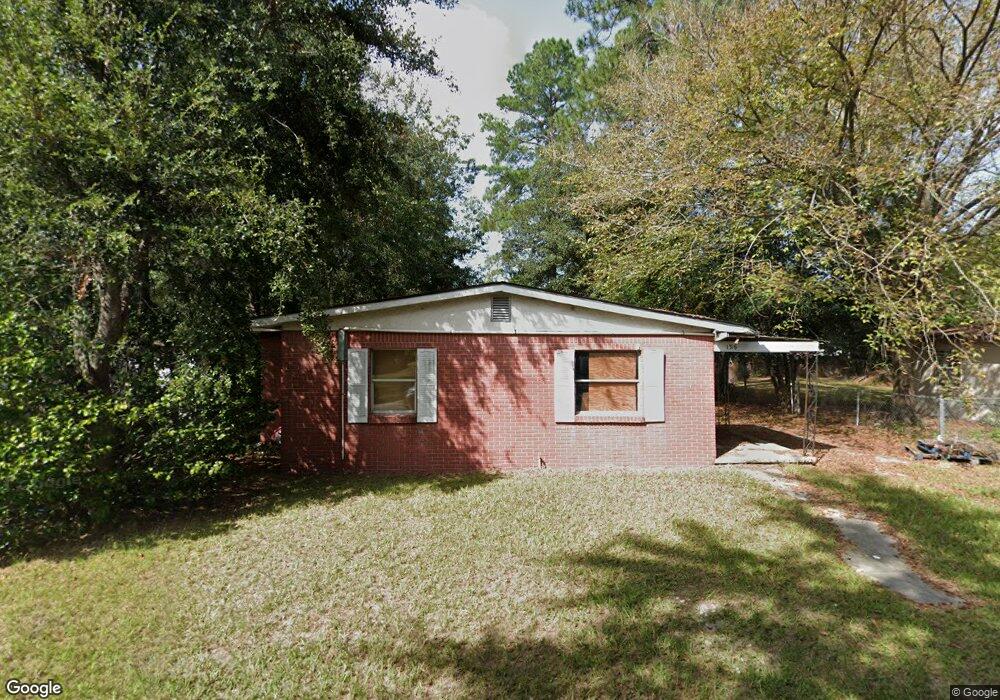
1316 Myers Ave Waycross, GA 31503
Estimated Value: $56,000 - $72,409
--
Bed
1
Bath
720
Sq Ft
$94/Sq Ft
Est. Value
About This Home
This home is located at 1316 Myers Ave, Waycross, GA 31503 and is currently estimated at $67,852, approximately $94 per square foot. 1316 Myers Ave is a home located in Ware County with nearby schools including Waresboro Elementary School, Ware County Middle School, and Ware County High School.
Ownership History
Date
Name
Owned For
Owner Type
Purchase Details
Closed on
Jan 31, 2020
Sold by
Schlumbrecht Chad
Bought by
Elliott Vince
Current Estimated Value
Purchase Details
Closed on
Sep 30, 2019
Sold by
Strickland Rental Properties Llc
Bought by
Schlumbrecht Chad
Home Financials for this Owner
Home Financials are based on the most recent Mortgage that was taken out on this home.
Original Mortgage
$27,000
Interest Rate
3.5%
Mortgage Type
Commercial
Purchase Details
Closed on
Dec 7, 2012
Sold by
Deal & Deal Rental Llc
Bought by
Strickland Rental Properties L
Purchase Details
Closed on
Sep 11, 2012
Sold by
Deal Vann
Bought by
Deal & Deal Rental Llc
Purchase Details
Closed on
Dec 13, 2010
Sold by
Day Roger W
Bought by
Deal Vann
Purchase Details
Closed on
Mar 25, 2002
Sold by
Hodge Linnie Marie
Bought by
Deal Vann and Deal Roger W
Purchase Details
Closed on
Jan 11, 1990
Bought by
Hodge Linnie Marie
Create a Home Valuation Report for This Property
The Home Valuation Report is an in-depth analysis detailing your home's value as well as a comparison with similar homes in the area
Home Values in the Area
Average Home Value in this Area
Purchase History
| Date | Buyer | Sale Price | Title Company |
|---|---|---|---|
| Elliott Vince | $7,000 | -- | |
| Schlumbrecht Chad | $34,000 | -- | |
| Strickland Rental Properties L | $21,500 | -- | |
| Deal & Deal Rental Llc | -- | -- | |
| Deal Vann | -- | -- | |
| Deal Vann | $19,500 | -- | |
| Hodge Linnie Marie | $20,000 | -- |
Source: Public Records
Mortgage History
| Date | Status | Borrower | Loan Amount |
|---|---|---|---|
| Previous Owner | Schlumbrecht Chad | $27,000 |
Source: Public Records
Tax History Compared to Growth
Tax History
| Year | Tax Paid | Tax Assessment Tax Assessment Total Assessment is a certain percentage of the fair market value that is determined by local assessors to be the total taxable value of land and additions on the property. | Land | Improvement |
|---|---|---|---|---|
| 2024 | $302 | $8,107 | $1,184 | $6,923 |
| 2023 | $280 | $12,068 | $836 | $11,232 |
| 2022 | $481 | $12,068 | $836 | $11,232 |
| 2021 | $121 | $8,782 | $836 | $7,946 |
| 2020 | $378 | $8,662 | $836 | $7,826 |
| 2019 | $276 | $6,254 | $836 | $5,418 |
| 2018 | $266 | $5,953 | $836 | $5,117 |
| 2017 | $363 | $5,953 | $836 | $5,117 |
| 2016 | $363 | $8,328 | $836 | $7,492 |
| 2015 | $366 | $8,328 | $836 | $7,492 |
| 2014 | $365 | $8,328 | $836 | $7,492 |
| 2013 | -- | $8,328 | $836 | $7,492 |
Source: Public Records
Map
Nearby Homes
- 00 Roosevelt St
- 00 Myers Ave
- 1401 Carswell Ave
- 605 Walker St
- 0 Camp Branch Cross Rd Unit 12958956
- 0 Camp Branch Cross Rd Unit 147575
- 0 Camp Branch Cross Rd Unit 10127958
- 1006 Roosevelt St
- 1003 Carswell Ave
- 601 N Nicholls St
- 6905 Kendal Ct
- 1322 Jane St
- 505 N Nicholls St
- 503 N Nicholls St
- 0 S Georgia Pkwy W
- 1208 Margaret St
- 506 McDonald St
- 516 Folks St
- 629 Remshart St
- 1103 Ann St
- 1318 Myers Ave
- 1314 Myers Ave
- 1317 Roosevelt St
- 1328 Myers Ave
- 1319 Roosevelt St
- 1312 Myers Ave
- 1321 Roosevelt St
- 1313 Roosevelt St
- 1317 Myers Ave
- 1327 Myers Ave
- 1330 Myers Ave
- 1312 Carswell Ave
- 1310 Myers Ave
- 1311 Roosevelt St
- 612 N Crawford St
- 1310 Carswell Ave
- 602 N Crawford St
- 1309 Roosevelt St
- 1309 Myers Ave
- 1308 Myers Ave