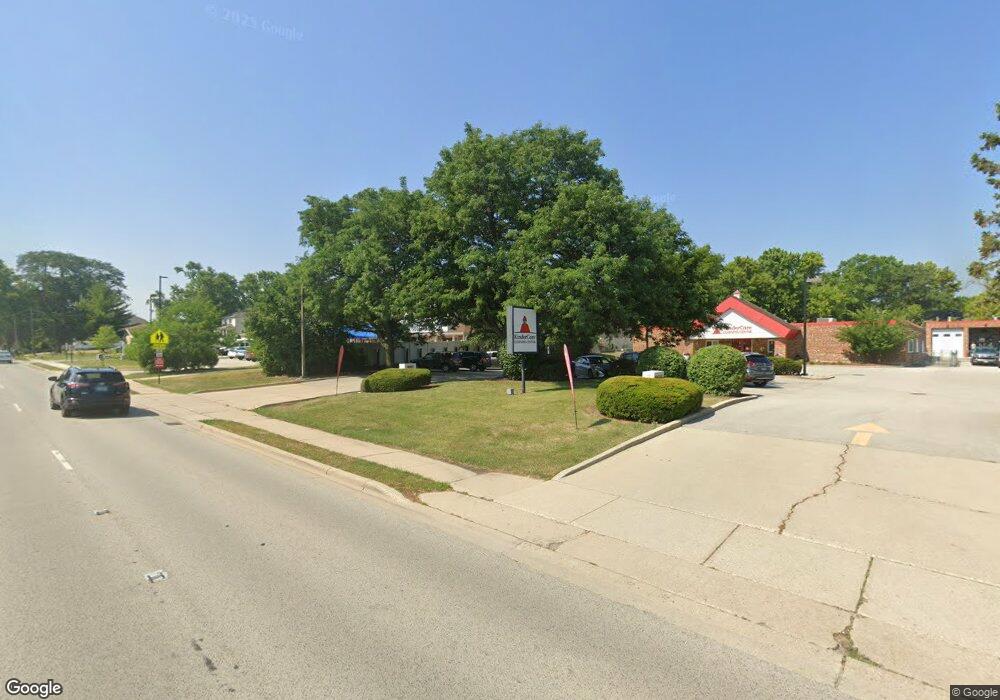
1316 N Arlington Heights Rd Arlington Heights, IL 60004
Estimated Value: $4,151,812
--
Bed
2
Baths
--
Sq Ft
0.96
Acres
About This Home
This home is located at 1316 N Arlington Heights Rd, Arlington Heights, IL 60004 and is currently estimated at $4,151,812. 1316 N Arlington Heights Rd is a home located in Cook County with nearby schools including Olive-Mary Stitt Elementary School, Thomas Middle School, and John Hersey High School.
Ownership History
Date
Name
Owned For
Owner Type
Purchase Details
Closed on
May 22, 2024
Sold by
Hina & Amir Llc
Bought by
Suvera Arlington Heights Chicago Cre Llc
Current Estimated Value
Home Financials for this Owner
Home Financials are based on the most recent Mortgage that was taken out on this home.
Original Mortgage
$1,070,000
Outstanding Balance
$901,215
Interest Rate
6.88%
Mortgage Type
Credit Line Revolving
Estimated Equity
$3,250,597
Purchase Details
Closed on
Dec 27, 2019
Sold by
Platt Cynthia F
Bought by
Hina & Amir Llc
Purchase Details
Closed on
Oct 4, 2011
Sold by
Platt James E and Platt Cynthia F
Bought by
Platt Cynthia F and Cynthia F Platt Trust
Purchase Details
Closed on
Oct 27, 1993
Sold by
Muran Ann M
Bought by
Platt James E and Platt Cynthia F
Home Financials for this Owner
Home Financials are based on the most recent Mortgage that was taken out on this home.
Original Mortgage
$450,000
Interest Rate
7.79%
Mortgage Type
Commercial
Create a Home Valuation Report for This Property
The Home Valuation Report is an in-depth analysis detailing your home's value as well as a comparison with similar homes in the area
Home Values in the Area
Average Home Value in this Area
Purchase History
| Date | Buyer | Sale Price | Title Company |
|---|---|---|---|
| Suvera Arlington Heights Chicago Cre Llc | $3,765,000 | None Listed On Document | |
| Hina & Amir Llc | $870,000 | Chicago Title | |
| Platt Cynthia F | -- | None Available | |
| Platt James E | $150,000 | -- | |
| Platt James E | $100,000 | -- |
Source: Public Records
Mortgage History
| Date | Status | Borrower | Loan Amount |
|---|---|---|---|
| Open | Suvera Arlington Heights Chicago Cre Llc | $1,070,000 | |
| Previous Owner | Platt James E | $450,000 |
Source: Public Records
Tax History Compared to Growth
Tax History
| Year | Tax Paid | Tax Assessment Tax Assessment Total Assessment is a certain percentage of the fair market value that is determined by local assessors to be the total taxable value of land and additions on the property. | Land | Improvement |
|---|---|---|---|---|
| 2024 | $124,877 | $456,157 | $156,668 | $299,489 |
| 2023 | $74,471 | $456,157 | $156,668 | $299,489 |
| 2022 | $74,471 | $282,454 | $156,668 | $125,786 |
| 2021 | $65,472 | $217,500 | $174,377 | $43,123 |
| 2020 | $63,778 | $217,500 | $174,377 | $43,123 |
| 2019 | $57,106 | $217,500 | $174,377 | $43,123 |
| 2018 | $41,084 | $140,786 | $104,626 | $36,160 |
| 2017 | $40,601 | $140,786 | $104,626 | $36,160 |
| 2016 | $36,397 | $135,320 | $104,626 | $30,694 |
| 2015 | $36,840 | $124,768 | $98,813 | $25,955 |
| 2014 | $58,085 | $202,637 | $98,813 | $103,824 |
| 2013 | $56,625 | $202,637 | $98,813 | $103,824 |
Source: Public Records
Map
Nearby Homes
- 1317 N Mitchell Ave
- 1142 N Mitchell Ave
- 1237 N Ridge Ave
- 1136 N Walnut Ave
- 1653 N Belmont Ct Unit 31
- 746 N Pine Ave
- 1670 N Douglas Ct Unit 86
- 827 N Walnut Ave
- 25 E Palatine Rd Unit 207
- 25 E Palatine Rd Unit 303
- 703 N Arlington Heights Rd
- 1518 N Patton Ave
- 1511 N Windsor Dr Unit 208
- 1603 N Windsor Dr Unit 102
- 1633 N Windsor Dr Unit 113
- 1825 N Kaspar Ave
- 121 W Fremont St
- 415 N Haddow Ave
- 1510 N Kendal Ct Unit 11510
- 1416 W Lynnwood Ave
- 1312 W North St
- 1312 N Arlington Heights Rd
- 1308 N Arlington Heights Rd
- 1304 N Arlington Heights Rd
- 1315 W North St
- 1319 N Arlington Heights Rd
- 1315 N Arlington Heights Rd
- 116 E Olive St
- 106 E Olive St
- 1311 N Arlington Heights Rd
- 1410 N Arlington Heights Rd
- 126 E Olive St
- 1309 N Arlington Heights Rd
- 1329 N Dunton Ave
- 1319 N Dunton Ave
- 1343 N Dunton Ave
- 1323 N Dunton Ave
- 1347 N Dunton Ave
- 1305 N Arlington Heights Rd
- 1307 N Dunton Ave