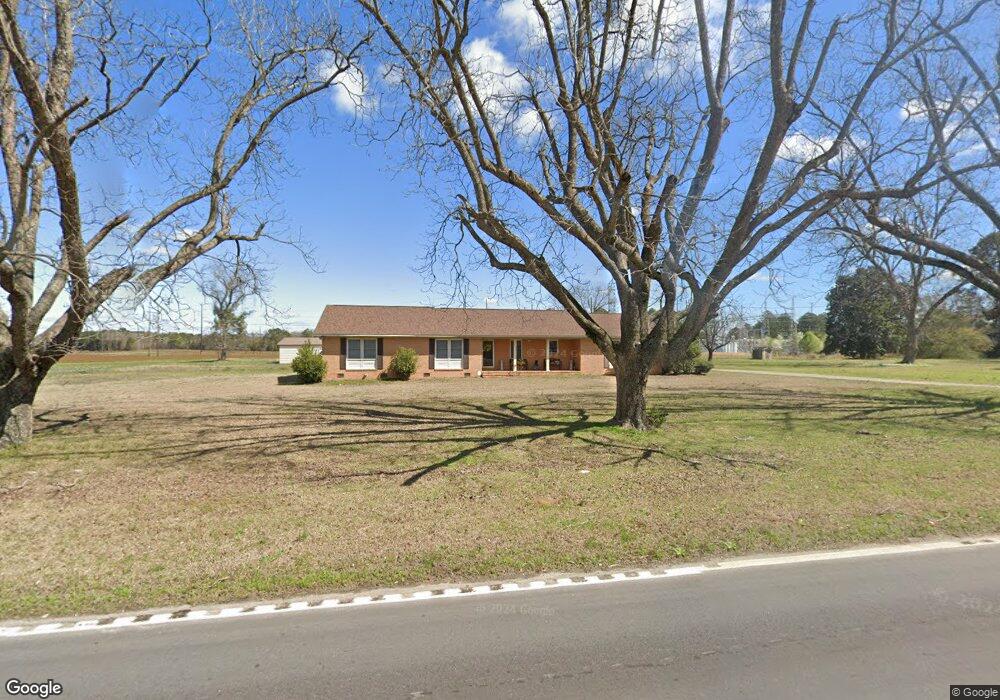
1316 N Douglas St Florence, SC 29501
Estimated Value: $181,000 - $219,000
3
Beds
2
Baths
1,848
Sq Ft
$109/Sq Ft
Est. Value
About This Home
This home is located at 1316 N Douglas St, Florence, SC 29501 and is currently estimated at $201,708, approximately $109 per square foot. 1316 N Douglas St is a home located in Florence County with nearby schools including Henry Timrod Elementary School, Williams Middle School, and Wilson High School.
Ownership History
Date
Name
Owned For
Owner Type
Purchase Details
Closed on
Sep 15, 2011
Sold by
Finklea Bryant A and Finklea Coleen W
Bought by
Coker Jimmie and Coker Johnnie Mae
Current Estimated Value
Purchase Details
Closed on
May 14, 2010
Sold by
Finklea Bryant A and Finklea William B
Bought by
Finklea Bryant A and Finklea Coleen W
Home Financials for this Owner
Home Financials are based on the most recent Mortgage that was taken out on this home.
Original Mortgage
$100,000
Outstanding Balance
$67,353
Interest Rate
5.15%
Mortgage Type
New Conventional
Estimated Equity
$134,355
Purchase Details
Closed on
Mar 26, 2010
Sold by
Estate Of Mary C Finklea
Bought by
Finklea Bryant A and Finklea William D
Home Financials for this Owner
Home Financials are based on the most recent Mortgage that was taken out on this home.
Original Mortgage
$100,000
Outstanding Balance
$67,353
Interest Rate
5.15%
Mortgage Type
New Conventional
Estimated Equity
$134,355
Create a Home Valuation Report for This Property
The Home Valuation Report is an in-depth analysis detailing your home's value as well as a comparison with similar homes in the area
Home Values in the Area
Average Home Value in this Area
Purchase History
| Date | Buyer | Sale Price | Title Company |
|---|---|---|---|
| Coker Jimmie | $135,000 | -- | |
| Finklea Bryant A | $56,000 | -- | |
| Finklea Bryant A | -- | -- |
Source: Public Records
Mortgage History
| Date | Status | Borrower | Loan Amount |
|---|---|---|---|
| Open | Finklea Bryant A | $100,000 |
Source: Public Records
Tax History Compared to Growth
Tax History
| Year | Tax Paid | Tax Assessment Tax Assessment Total Assessment is a certain percentage of the fair market value that is determined by local assessors to be the total taxable value of land and additions on the property. | Land | Improvement |
|---|---|---|---|---|
| 2024 | $456 | $7,616 | $622 | $6,994 |
| 2023 | $370 | $5,537 | $622 | $4,915 |
| 2022 | $534 | $5,537 | $622 | $4,915 |
| 2021 | $2,941 | $8,310 | $0 | $0 |
| 2020 | $701 | $5,540 | $0 | $0 |
| 2019 | $491 | $5,537 | $622 | $4,915 |
| 2018 | $465 | $5,540 | $0 | $0 |
| 2017 | $419 | $5,540 | $0 | $0 |
| 2016 | $326 | $5,540 | $0 | $0 |
| 2015 | $503 | $5,540 | $0 | $0 |
| 2014 | $296 | $5,537 | $622 | $4,915 |
Source: Public Records
Map
Nearby Homes
- 311 W Williams Blvd
- 414 W Vista St
- 404 W Vista St
- 312 W Vista St
- TBD W Ashby Rd
- 1551 N Sierra Range
- 707 Chase St
- 824 Commander St
- 822 Commander St
- 818 Commander St
- 610 Carver St
- 139 Wingate Ave
- 904 Carver St
- 709 Ingram St
- 1510 N Rocky Way Dr
- 610 Lawson St
- 929 Ingram St
- 910 W Ingram St
- 408 Dixie St
- 1900 W Kirby Dr
- 0 N Douglas St
- 1306 N Douglas St
- 1307 N Douglas St
- 1301 N Douglas St
- 1221 N Douglas St
- 1222 N Douglas St
- 1325 Tallulah St
- 1321 Tallulah St
- 1209 N Douglas St
- 1319 Tallulah St
- 1315 Tallulah St
- 1326 Tallulah St
- 1313 Tallulah St
- 307 Williams Blvd
- 1322 Tallulah St
- 1309 Tallulah St
- 1318 Tallulah St
- 305 Williams Blvd
- 1305 Tallulah St
- 249 N Point Dr