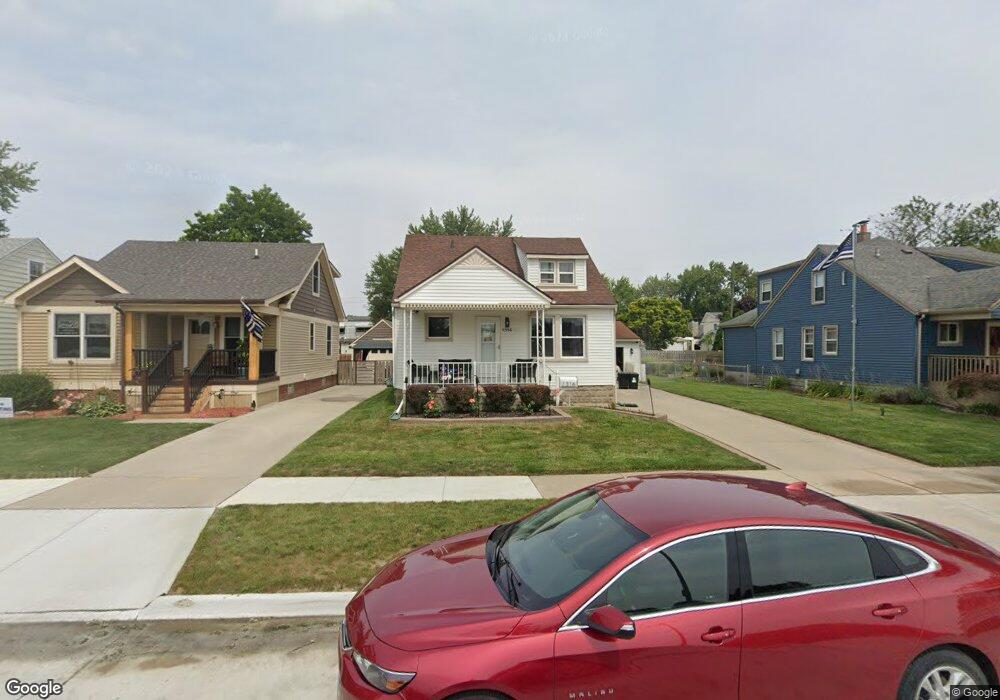
1316 Oxford Ct Unit Bldg-Unit Wyandotte, MI 48192
Estimated Value: $184,083 - $226,000
--
Bed
1
Bath
930
Sq Ft
$218/Sq Ft
Est. Value
About This Home
This home is located at 1316 Oxford Ct Unit Bldg-Unit, Wyandotte, MI 48192 and is currently estimated at $202,771, approximately $218 per square foot. 1316 Oxford Ct Unit Bldg-Unit is a home located in Wayne County with nearby schools including Washington Elementary School, Woodrow Wilson School, and Roosevelt High School.
Ownership History
Date
Name
Owned For
Owner Type
Purchase Details
Closed on
Feb 13, 2018
Sold by
Jims Pravda Llc
Bought by
Jones Brent
Current Estimated Value
Purchase Details
Closed on
Feb 26, 2015
Sold by
Copley Theodore and Kerr Darcy
Bought by
Conejo Capital Partners 2 Llc
Purchase Details
Closed on
Apr 5, 2009
Sold by
Kerr Darcy L and Copley Darcy L
Bought by
Copley Theodore L
Purchase Details
Closed on
Jun 29, 2004
Sold by
Garant Curtis A and Garant Cheryl L
Bought by
Copley Theodore L
Purchase Details
Closed on
Jul 27, 1999
Sold by
Esther Hemswor David R and Esther Hemswor
Bought by
Garant Cheryl L and Garant Curtis A
Create a Home Valuation Report for This Property
The Home Valuation Report is an in-depth analysis detailing your home's value as well as a comparison with similar homes in the area
Home Values in the Area
Average Home Value in this Area
Purchase History
| Date | Buyer | Sale Price | Title Company |
|---|---|---|---|
| Jones Brent | $125,000 | None Available | |
| Conejo Capital Partners 2 Llc | $40,544 | None Available | |
| Jims Pravda Llc | $1,700 | None Available | |
| Copley Theodore L | -- | None Available | |
| Copley Theodore L | $138,500 | First American Title Southea | |
| Garant Cheryl L | $110,000 | -- |
Source: Public Records
Tax History Compared to Growth
Tax History
| Year | Tax Paid | Tax Assessment Tax Assessment Total Assessment is a certain percentage of the fair market value that is determined by local assessors to be the total taxable value of land and additions on the property. | Land | Improvement |
|---|---|---|---|---|
| 2025 | $2,611 | $82,200 | $0 | $0 |
| 2024 | $2,611 | $77,700 | $0 | $0 |
| 2023 | $2,490 | $72,400 | $0 | $0 |
| 2022 | $2,884 | $66,400 | $0 | $0 |
| 2021 | $2,826 | $61,800 | $0 | $0 |
| 2020 | $2,787 | $56,000 | $0 | $0 |
| 2019 | $2,749 | $50,100 | $0 | $0 |
| 2018 | $1,640 | $43,600 | $0 | $0 |
| 2017 | $1,370 | $43,600 | $0 | $0 |
| 2016 | $1,984 | $40,400 | $0 | $0 |
| 2015 | $3,541 | $37,500 | $0 | $0 |
| 2013 | $3,430 | $34,300 | $0 | $0 |
| 2012 | $1,593 | $35,900 | $11,100 | $24,800 |
Source: Public Records
Map
Nearby Homes