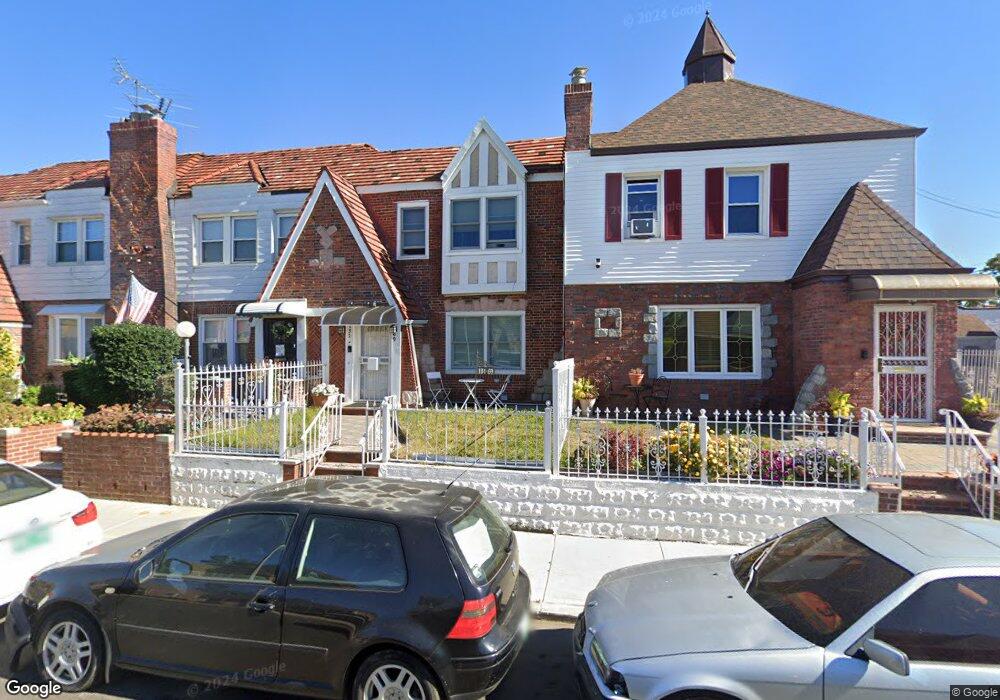
13169 224th St Laurelton, NY 11413
Laurelton NeighborhoodEstimated Value: $658,000 - $792,000
3
Beds
1
Bath
1,410
Sq Ft
$507/Sq Ft
Est. Value
About This Home
This home is located at 13169 224th St, Laurelton, NY 11413 and is currently estimated at $714,927, approximately $507 per square foot. 13169 224th St is a home located in Queens County with nearby schools including P.S. 132 - Ralph Bunche, Is 59 Springfield Gardens, and Success Academy Springfield Gardens.
Ownership History
Date
Name
Owned For
Owner Type
Purchase Details
Closed on
Oct 22, 2018
Sold by
Lilley Marcella and Lilley Myrtle M
Bought by
Campbell Shanna
Current Estimated Value
Home Financials for this Owner
Home Financials are based on the most recent Mortgage that was taken out on this home.
Original Mortgage
$460,750
Outstanding Balance
$402,656
Interest Rate
4.6%
Mortgage Type
Purchase Money Mortgage
Estimated Equity
$312,271
Purchase Details
Closed on
Feb 23, 2000
Sold by
Galit Development Corp
Bought by
Lilley Myrtle M and Lilley Marcella
Home Financials for this Owner
Home Financials are based on the most recent Mortgage that was taken out on this home.
Original Mortgage
$204,250
Interest Rate
8.18%
Mortgage Type
FHA
Purchase Details
Closed on
Dec 28, 1999
Sold by
Curry Vernell and Mcintosh Godfrey
Bought by
Galit Development Corp
Home Financials for this Owner
Home Financials are based on the most recent Mortgage that was taken out on this home.
Original Mortgage
$204,250
Interest Rate
8.18%
Mortgage Type
FHA
Create a Home Valuation Report for This Property
The Home Valuation Report is an in-depth analysis detailing your home's value as well as a comparison with similar homes in the area
Home Values in the Area
Average Home Value in this Area
Purchase History
| Date | Buyer | Sale Price | Title Company |
|---|---|---|---|
| Campbell Shanna | $485,000 | -- | |
| Lilley Myrtle M | $206,000 | Fidelity National Title Ins | |
| Galit Development Corp | $155,000 | -- |
Source: Public Records
Mortgage History
| Date | Status | Borrower | Loan Amount |
|---|---|---|---|
| Open | Campbell Shanna | $460,750 | |
| Previous Owner | Lilley Myrtle M | $204,250 |
Source: Public Records
Tax History Compared to Growth
Tax History
| Year | Tax Paid | Tax Assessment Tax Assessment Total Assessment is a certain percentage of the fair market value that is determined by local assessors to be the total taxable value of land and additions on the property. | Land | Improvement |
|---|---|---|---|---|
| 2025 | $5,935 | $31,054 | $8,632 | $22,422 |
| 2024 | $4,489 | $29,549 | $8,744 | $20,805 |
| 2023 | $5,933 | $29,539 | $8,412 | $21,127 |
| 2022 | $5,563 | $32,400 | $10,440 | $21,960 |
| 2021 | $5,772 | $31,380 | $10,440 | $20,940 |
| 2020 | $5,478 | $27,000 | $10,440 | $16,560 |
| 2019 | $5,151 | $28,380 | $10,440 | $17,940 |
| 2018 | $5,018 | $24,616 | $9,476 | $15,140 |
| 2017 | $4,734 | $23,223 | $10,204 | $13,019 |
| 2016 | $4,569 | $23,223 | $10,204 | $13,019 |
| 2015 | $2,642 | $21,565 | $10,839 | $10,726 |
| 2014 | $2,642 | $20,520 | $11,580 | $8,940 |
Source: Public Records
Map
Nearby Homes
- 133-23 225th St
- 133-22 226th St
- 131-41 226th St Unit 60
- 131-35 222nd St
- 131-20 224th St
- 131-18 226th St
- 22310 131st Ave
- 223-12 134th Rd
- 13062 225th St
- 134-15 221st St
- 13315 228th St
- 133-15 220th St
- 22126 134th Rd
- 131-33 228th St
- 134-16 221st St
- 130-43 224th St
- 220-27 134th Rd
- 13069 227th St
- 21931 133rd Ave
- 220-24 134th Rd