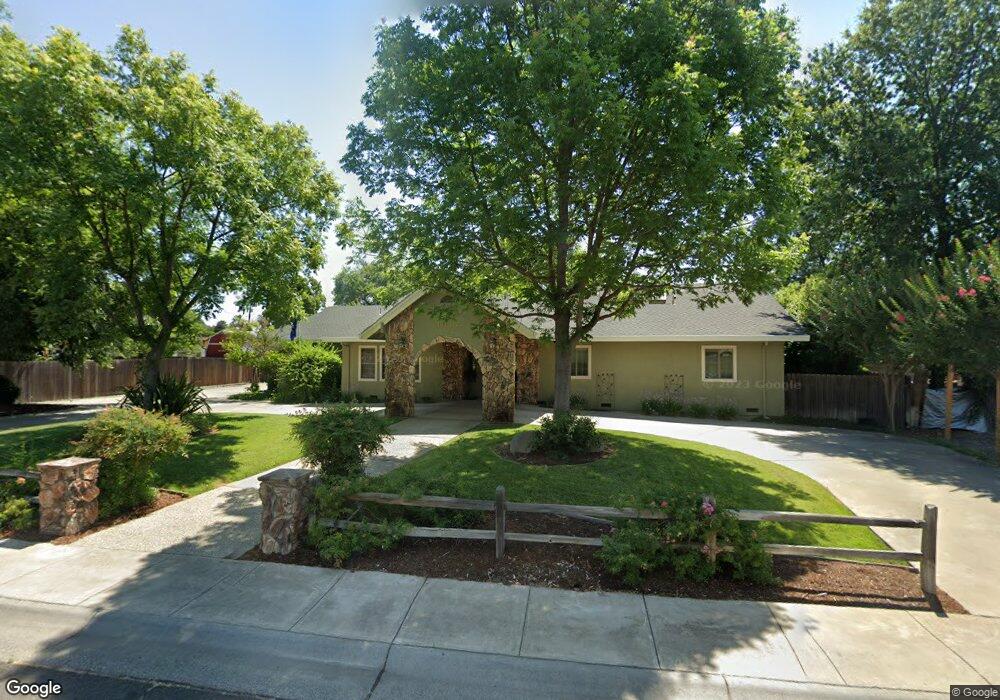
1317 2nd St Colusa, CA 95932
Estimated Value: $584,000 - $756,000
2
Beds
3
Baths
2,760
Sq Ft
$233/Sq Ft
Est. Value
About This Home
This home is located at 1317 2nd St, Colusa, CA 95932 and is currently estimated at $642,672, approximately $232 per square foot. 1317 2nd St is a home located in Colusa County with nearby schools including James M. Burchfield Primary School, George T. Egling Middle School, and Colusa High School.
Ownership History
Date
Name
Owned For
Owner Type
Purchase Details
Closed on
Dec 5, 2023
Sold by
Newlin Ralph E L and Newlin Nancy L
Bought by
Newlin Ralph E and Newlin Nancy L
Current Estimated Value
Home Financials for this Owner
Home Financials are based on the most recent Mortgage that was taken out on this home.
Original Mortgage
$94,750
Outstanding Balance
$93,159
Interest Rate
7.44%
Mortgage Type
New Conventional
Estimated Equity
$549,513
Purchase Details
Closed on
Jan 5, 2007
Sold by
Basgall Diane M and Basgall James
Bought by
Newlin Ralph E L and Newlin Nancy L
Create a Home Valuation Report for This Property
The Home Valuation Report is an in-depth analysis detailing your home's value as well as a comparison with similar homes in the area
Home Values in the Area
Average Home Value in this Area
Purchase History
We collect this data history from publicly available records. To have your information removed, we recommend requesting removal directly through your county’s website.
| Date | Buyer | Sale Price | Title Company |
|---|---|---|---|
| Newlin Ralph E | -- | Atlas Title Company | |
| Newlin Ralph E L | $375,000 | North State Title Company |
Source: Public Records
Mortgage History
We collect this data history from publicly available records. To have your information removed, we recommend requesting removal directly through your county’s website.
| Date | Status | Borrower | Loan Amount |
|---|---|---|---|
| Open | Newlin Ralph E | $94,750 |
Source: Public Records
Tax History
| Year | Tax Paid | Tax Assessment Tax Assessment Total Assessment is a certain percentage of the fair market value that is determined by local assessors to be the total taxable value of land and additions on the property. | Land | Improvement |
|---|---|---|---|---|
| 2025 | $5,247 | $502,403 | $107,173 | $395,230 |
| 2024 | $5,247 | $492,553 | $105,072 | $387,481 |
| 2023 | $5,051 | $482,896 | $103,012 | $379,884 |
| 2022 | $5,060 | $473,429 | $100,993 | $372,436 |
| 2021 | $4,007 | $383,000 | $75,000 | $308,000 |
| 2020 | $3,690 | $353,000 | $60,000 | $293,000 |
| 2019 | $3,659 | $353,000 | $60,000 | $293,000 |
| 2018 | $3,522 | $333,000 | $50,000 | $283,000 |
| 2017 | $3,218 | $303,000 | $45,000 | $258,000 |
| 2016 | $3,238 | $303,000 | $45,000 | $258,000 |
| 2015 | $2,928 | $274,000 | $45,000 | $229,000 |
| 2014 | $2,326 | $225,000 | $45,000 | $180,000 |
Source: Public Records
Map
Nearby Homes
- 303 Louis Ln
- 7300 Farinon Rd
- 0 E Carson St Unit 225122408
- 130 Fremont St
- 1425 5th St
- 1732 Wescott Rd
- 1801 Highway 20 Unit 2
- 35 Parkhill St
- 115 Country Club Dr
- 546 Parkhill St
- 547 Clay St
- 724 Webster St
- 738 Webster St
- 528 Clay St
- 853 11th St
- 243 7th St
- 212 Country Club Dr
- 80 2nd St
- 745 Main St
- 434 Kittyhawk Rd
Your Personal Tour Guide
Ask me questions while you tour the home.