Estimated Value: $388,145 - $413,000
Studio
2
Baths
1,654
Sq Ft
$241/Sq Ft
Est. Value
About This Home
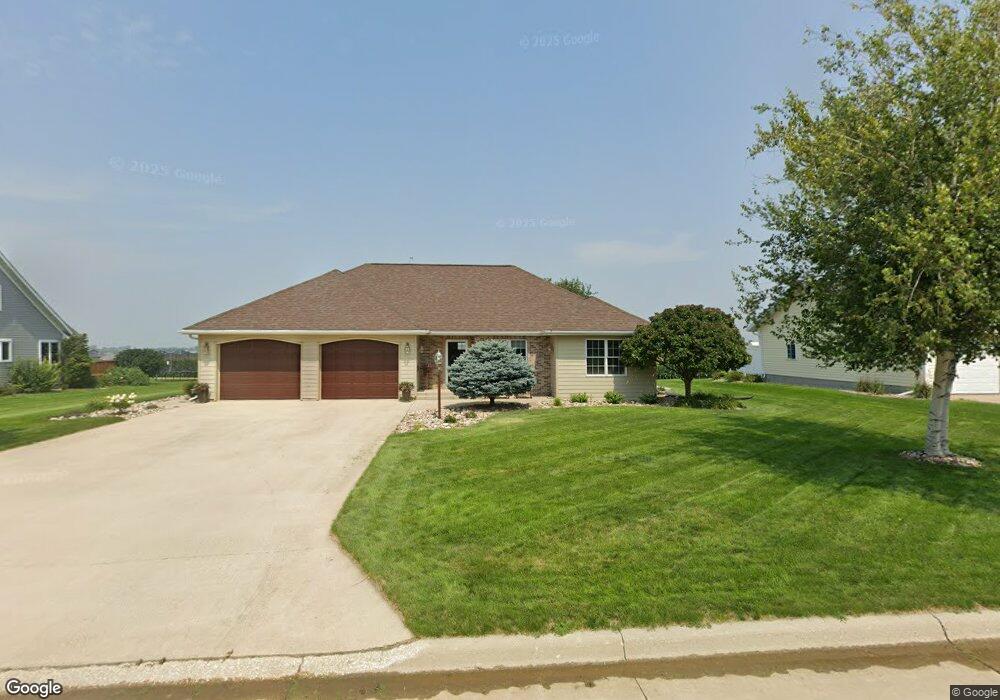
This home is located at 1317 8th St, Hull, IA 51239 and is currently estimated at $398,286, approximately $240 per square foot. 1317 8th St is a home located in Sioux County with nearby schools including Boyden-Hull Elementary School, Boyden-Hull High School, and Hull Christian School.
Ownership History
Date
Name
Owned For
Owner Type
Purchase Details
Closed on
Aug 17, 2021
Sold by
Vanmaanen Dennis Van and Vanmaanen Audrey Van
Bought by
Maanen Dennis L Van and Vanmaanen Audrey Van
Current Estimated Value
Purchase Details
Closed on
Jul 25, 2005
Sold by
Ohde Dennis D and Ohde Joyce L
Bought by
Vanmaanen Dennis L and Van Maanen Audrey
Home Financials for this Owner
Home Financials are based on the most recent Mortgage that was taken out on this home.
Original Mortgage
$168,000
Interest Rate
5.83%
Mortgage Type
New Conventional
Create a Home Valuation Report for This Property
The Home Valuation Report is an in-depth analysis detailing your home's value as well as a comparison with similar homes in the area
Purchase History
| Date | Buyer | Sale Price | Title Company |
|---|---|---|---|
| Maanen Dennis L Van | -- | None Available | |
| Vanmaanen Dennis L | $210,000 | None Available |
Source: Public Records
Mortgage History
| Date | Status | Borrower | Loan Amount |
|---|---|---|---|
| Previous Owner | Vanmaanen Dennis L | $168,000 |
Source: Public Records
Tax History
| Year | Tax Paid | Tax Assessment Tax Assessment Total Assessment is a certain percentage of the fair market value that is determined by local assessors to be the total taxable value of land and additions on the property. | Land | Improvement |
|---|---|---|---|---|
| 2025 | $5,300 | $458,310 | $29,700 | $428,610 |
| 2024 | $5,300 | $381,560 | $29,700 | $351,860 |
| 2023 | $5,320 | $381,560 | $29,700 | $351,860 |
| 2022 | $5,536 | $328,860 | $29,700 | $299,160 |
| 2021 | $5,242 | $332,920 | $29,700 | $303,220 |
| 2020 | $5,242 | $300,390 | $29,700 | $270,690 |
| 2019 | $4,966 | $281,660 | $22,280 | $259,380 |
| 2018 | $5,062 | $281,660 | $22,280 | $259,380 |
| 2017 | $5,062 | $281,660 | $22,280 | $259,380 |
| 2014 | $4,068 | $230,900 | $0 | $0 |
Source: Public Records
Map
Nearby Homes
- 1311 Aspen St
- 2014 Maple St
- 1107 4th St
- 1219 3rd St
- 1208 2nd St
- 1502 2nd St
- 1818 1st St
- 1509 Birch St
- 423 Railroad St
- 301 Black Forest Rd
- 3273 Hickory Ave
- 3451 Jackson Ave
- 3585 Ironwood Ave
- 3920 310th St
- 408 Grove St
- 1003 Horizon Rd
- 2629 Warren Cir
- 1558 11th Ave NE
- 1026 15th St Cir NE
- 936 14th Street Cir NE
Your Personal Tour Guide
Ask me questions while you tour the home.