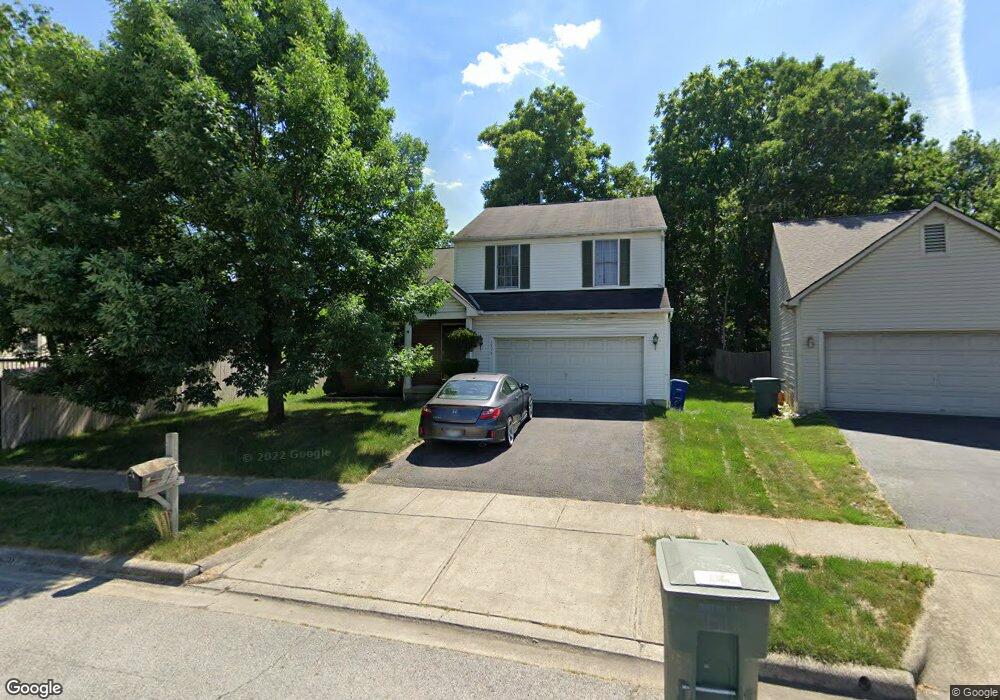
1317 Bluffton Ct Columbus, OH 43228
Trabue Woods NeighborhoodEstimated Value: $316,000 - $376,000
3
Beds
3
Baths
1,916
Sq Ft
$185/Sq Ft
Est. Value
About This Home
This home is located at 1317 Bluffton Ct, Columbus, OH 43228 and is currently estimated at $353,557, approximately $184 per square foot. 1317 Bluffton Ct is a home located in Franklin County with nearby schools including Hilliard Horizon Elementary School, Hilliard Station Sixth Grade Elementary School, and Hilliard Heritage Middle School.
Ownership History
Date
Name
Owned For
Owner Type
Purchase Details
Closed on
May 26, 2004
Sold by
Hud
Bought by
Vanninh Dung Van
Current Estimated Value
Purchase Details
Closed on
Jan 5, 2004
Sold by
Gould Edward M and Union Federal Bank Of Indianap
Bought by
Hud
Purchase Details
Closed on
Apr 10, 2000
Sold by
Dominion Homes Inc
Bought by
Gould Edward M and Gould Lori A
Home Financials for this Owner
Home Financials are based on the most recent Mortgage that was taken out on this home.
Original Mortgage
$166,635
Interest Rate
8.29%
Mortgage Type
FHA
Create a Home Valuation Report for This Property
The Home Valuation Report is an in-depth analysis detailing your home's value as well as a comparison with similar homes in the area
Home Values in the Area
Average Home Value in this Area
Purchase History
| Date | Buyer | Sale Price | Title Company |
|---|---|---|---|
| Vanninh Dung Van | $165,500 | -- | |
| Hud | $110,000 | -- | |
| Gould Edward M | $166,800 | Alliance Title |
Source: Public Records
Mortgage History
| Date | Status | Borrower | Loan Amount |
|---|---|---|---|
| Previous Owner | Gould Edward M | $166,635 |
Source: Public Records
Tax History
| Year | Tax Paid | Tax Assessment Tax Assessment Total Assessment is a certain percentage of the fair market value that is determined by local assessors to be the total taxable value of land and additions on the property. | Land | Improvement |
|---|---|---|---|---|
| 2025 | $4,086 | $112,070 | $29,050 | $83,020 |
| 2024 | $4,086 | $112,070 | $29,050 | $83,020 |
| 2023 | $4,014 | $112,070 | $29,050 | $83,020 |
| 2022 | $3,912 | $80,160 | $13,130 | $67,030 |
| 2021 | $3,991 | $80,160 | $13,130 | $67,030 |
| 2020 | $3,968 | $80,160 | $13,130 | $67,030 |
| 2019 | $3,548 | $63,250 | $10,500 | $52,750 |
| 2018 | $3,489 | $63,250 | $10,500 | $52,750 |
| 2017 | $3,481 | $63,250 | $10,500 | $52,750 |
| 2016 | $3,446 | $56,950 | $8,860 | $48,090 |
| 2015 | $3,446 | $56,950 | $8,860 | $48,090 |
| 2014 | $3,449 | $56,950 | $8,860 | $48,090 |
| 2013 | $1,710 | $56,945 | $8,855 | $48,090 |
Source: Public Records
Map
Nearby Homes
- 1174 Onaway Ct
- 4006 Sandy Ridge Dr
- 3996 Deer Lake Way
- 1593 Raspberry Run Dr
- 3985 Spyglass Dr
- 3870 Cypress Creek Dr
- 464 Yarmouth Ln
- 399 Carilla Ln
- 463 Darbyhurst Rd
- 417 Revere Ct
- 2378 Myrtle Valley Dr
- 4899 Hamden Way
- 3271 Dover Rd
- 305 Danhurst Rd
- 2176 Bigby Hollow St
- 218 Darbyhurst Rd
- 5079 Hilliard Green Dr
- 4920 Meadow Run Dr Unit 4920
- 2252 Yagger Bay Dr
- 396 Pasadena Ave
- 1323 Bluffton Ct
- 1303 Tenagra Way
- 1309 Tenagra Way
- 1329 Bluffton Ct
- 1297 Tenagra Way
- 4424 Gaffney Ct
- 1291 Tenagra Way
- 1320 Bluffton Ct
- 1335 Bluffton Ct
- 1335 Bluffton Ct Unit 179
- 4430 Gaffney Ct
- 1326 Bluffton Ct
- 1314 Bluffton Ct
- 1285 Tenagra Way
- 1341 Bluffton Ct
- 1332 Bluffton Ct
- 4418 Gaffney Ct
- 1333 Tenagra Way
- 1347 Bluffton Ct
- 1338 Bluffton Ct
Your Personal Tour Guide
Ask me questions while you tour the home.