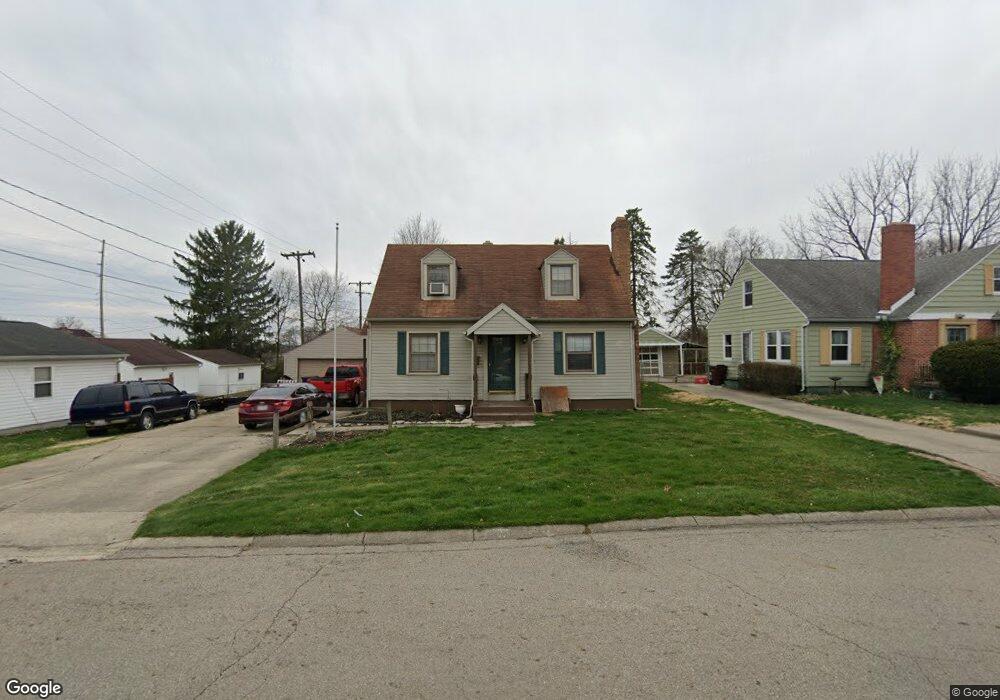
1317 Crestview Dr Springfield, OH 45504
Estimated Value: $160,000 - $178,000
2
Beds
1
Bath
1,225
Sq Ft
$139/Sq Ft
Est. Value
About This Home
This home is located at 1317 Crestview Dr, Springfield, OH 45504 and is currently estimated at $170,352, approximately $139 per square foot. 1317 Crestview Dr is a home located in Clark County with nearby schools including Snowhill Elementary School, Roosevelt Middle School, and Springfield High School.
Ownership History
Date
Name
Owned For
Owner Type
Purchase Details
Closed on
Apr 18, 2007
Sold by
Bostick Robbie E and Bostick Tracie L
Bought by
Hahn Richard B and Hahn Sheryl B
Current Estimated Value
Home Financials for this Owner
Home Financials are based on the most recent Mortgage that was taken out on this home.
Original Mortgage
$101,408
Outstanding Balance
$61,415
Interest Rate
6.18%
Mortgage Type
FHA
Estimated Equity
$108,937
Purchase Details
Closed on
Mar 14, 1994
Sold by
Schneider Paul R and Schneider Cynthia L
Bought by
Bostick Robbie E and Bostick Tracie L
Purchase Details
Closed on
Apr 6, 1987
Create a Home Valuation Report for This Property
The Home Valuation Report is an in-depth analysis detailing your home's value as well as a comparison with similar homes in the area
Home Values in the Area
Average Home Value in this Area
Purchase History
| Date | Buyer | Sale Price | Title Company |
|---|---|---|---|
| Hahn Richard B | $103,000 | Attorney | |
| Bostick Robbie E | $65,000 | -- | |
| -- | $49,000 | -- |
Source: Public Records
Mortgage History
| Date | Status | Borrower | Loan Amount |
|---|---|---|---|
| Open | Hahn Richard B | $101,408 |
Source: Public Records
Tax History Compared to Growth
Tax History
| Year | Tax Paid | Tax Assessment Tax Assessment Total Assessment is a certain percentage of the fair market value that is determined by local assessors to be the total taxable value of land and additions on the property. | Land | Improvement |
|---|---|---|---|---|
| 2024 | $1,177 | $33,590 | $8,160 | $25,430 |
| 2023 | $1,177 | $33,590 | $8,160 | $25,430 |
| 2022 | $1,226 | $33,590 | $8,160 | $25,430 |
| 2021 | $958 | $26,670 | $6,280 | $20,390 |
| 2020 | $955 | $26,570 | $6,170 | $20,400 |
| 2019 | $957 | $26,570 | $6,170 | $20,400 |
| 2018 | $964 | $25,990 | $5,360 | $20,630 |
| 2017 | $964 | $29,474 | $5,362 | $24,112 |
| 2016 | $965 | $29,474 | $5,362 | $24,112 |
| 2015 | $1,017 | $29,474 | $5,362 | $24,112 |
| 2014 | $1,012 | $29,474 | $5,362 | $24,112 |
| 2013 | $1,002 | $29,474 | $5,362 | $24,112 |
Source: Public Records
Map
Nearby Homes