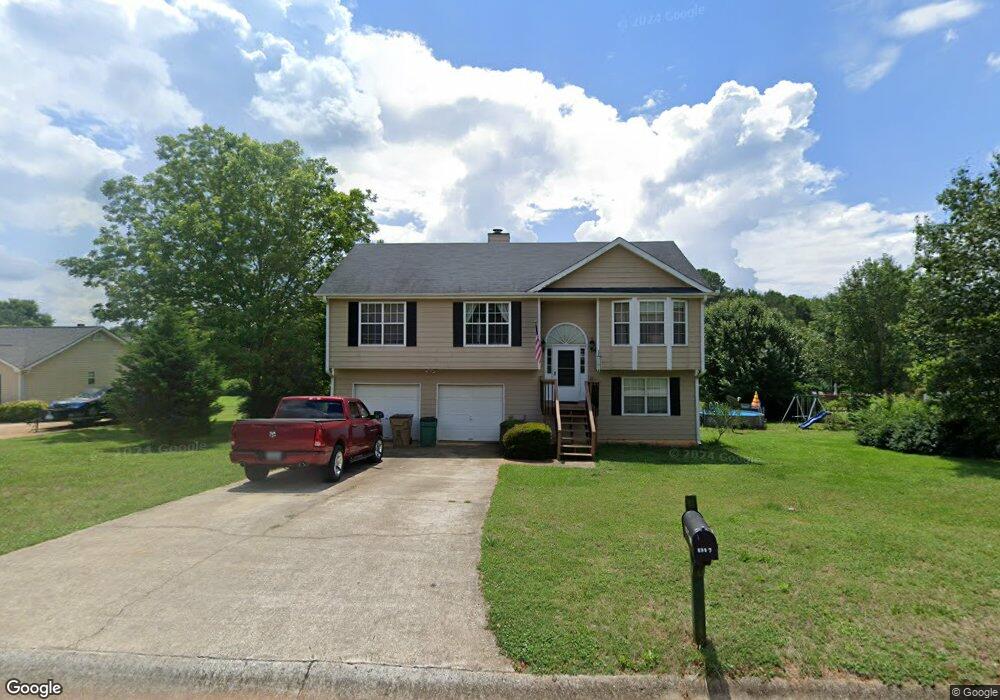
1317 Crestview Rd Winder, GA 30680
Estimated Value: $283,979 - $332,000
3
Beds
2
Baths
1,648
Sq Ft
$191/Sq Ft
Est. Value
About This Home
This home is located at 1317 Crestview Rd, Winder, GA 30680 and is currently estimated at $315,245, approximately $191 per square foot. 1317 Crestview Rd is a home located in Barrow County with nearby schools including Bethlehem Elementary School, Haymon-Morris Middle School, and Apalachee High School.
Ownership History
Date
Name
Owned For
Owner Type
Purchase Details
Closed on
Mar 26, 2002
Sold by
Hutchinson David M and Hutchinson India A
Bought by
Gieszler Mark B and Gieszler Telna M
Current Estimated Value
Home Financials for this Owner
Home Financials are based on the most recent Mortgage that was taken out on this home.
Original Mortgage
$115,093
Outstanding Balance
$46,396
Interest Rate
6.85%
Mortgage Type
FHA
Estimated Equity
$268,849
Purchase Details
Closed on
Mar 31, 1998
Sold by
Royster Earl L
Bought by
Hutchinson David M and Hutchinson India A
Home Financials for this Owner
Home Financials are based on the most recent Mortgage that was taken out on this home.
Original Mortgage
$86,687
Interest Rate
7.06%
Mortgage Type
FHA
Purchase Details
Closed on
Sep 11, 1996
Sold by
And Maynard Jerry M
Bought by
Reynolds James E
Purchase Details
Closed on
Jul 23, 1996
Sold by
Maynard Jerry M
Bought by
And Maynard Jerry M
Create a Home Valuation Report for This Property
The Home Valuation Report is an in-depth analysis detailing your home's value as well as a comparison with similar homes in the area
Home Values in the Area
Average Home Value in this Area
Purchase History
| Date | Buyer | Sale Price | Title Company |
|---|---|---|---|
| Gieszler Mark B | $116,900 | -- | |
| Hutchinson David M | $87,000 | -- | |
| Reynolds James E | -- | -- | |
| And Maynard Jerry M | -- | -- |
Source: Public Records
Mortgage History
| Date | Status | Borrower | Loan Amount |
|---|---|---|---|
| Open | Gieszler Mark B | $115,093 | |
| Previous Owner | Hutchinson David M | $86,687 |
Source: Public Records
Tax History
| Year | Tax Paid | Tax Assessment Tax Assessment Total Assessment is a certain percentage of the fair market value that is determined by local assessors to be the total taxable value of land and additions on the property. | Land | Improvement |
|---|---|---|---|---|
| 2025 | $678 | $88,330 | $20,400 | $67,930 |
| 2024 | $2,122 | $86,364 | $20,400 | $65,964 |
| 2023 | $1,699 | $86,764 | $20,400 | $66,364 |
| 2022 | $2,201 | $78,097 | $20,400 | $57,697 |
| 2021 | $2,188 | $73,697 | $16,000 | $57,697 |
| 2020 | $1,859 | $62,607 | $16,000 | $46,607 |
| 2019 | $1,891 | $62,607 | $16,000 | $46,607 |
| 2018 | $1,608 | $54,598 | $10,000 | $44,598 |
| 2017 | $1,098 | $37,722 | $10,000 | $27,722 |
| 2016 | $1,078 | $38,056 | $10,000 | $28,056 |
| 2015 | $1,103 | $38,722 | $10,000 | $28,722 |
| 2014 | $992 | $34,935 | $5,880 | $29,055 |
| 2013 | -- | $33,549 | $5,880 | $27,669 |
Source: Public Records
Map
Nearby Homes
- 0 Perkins Rd Unit 10623675
- 0 Perkins Rd Unit 7664605
- 195 Bowman Dr
- 890 Smith Mill Rd
- 117 Bowman Ct
- 938 Austin Rd
- 1211 Hog Mountain Rd
- 986 Austin Rd
- 1194 Foster Rd
- 1 Us 53 Hwy
- 868 Smith Mill Rd
- 0 Wall Rd Unit 10504981
- 0 Wall Rd Unit 7564754
- 564 Elder Rd SE
- 572 Elder Rd SE
- 568 Elder Rd SE
- 576 Elder Rd SE
- 1319 Bethlehem Rd
- 33 Cochin Dr
- 1006 Trichur Rd
- 1313 Crestview Rd
- 1319 Crestview Rd
- 1041 Crestview Ct
- 1321 Crestview Rd
- 1322 Crestview Rd
- 1312 Crestview Rd
- 1323 Crestview Rd
- 1042 Crestview Ct
- 1043 Crestview Ct
- 1044 Crestview Ct
- 1326 Crestview Rd
- 1325 Crestview Rd
- 1325 Crestview Rd Unit 6
- 1045 Crestview Ct
- 1060 Bethlehem Rd
- 1400 Langdon Park Ct
- 1031 Bethlehem Rd
- 1401 Langdon Park Ct
- 1328 Crestview Rd
- 1327 Crestview Rd
Your Personal Tour Guide
Ask me questions while you tour the home.