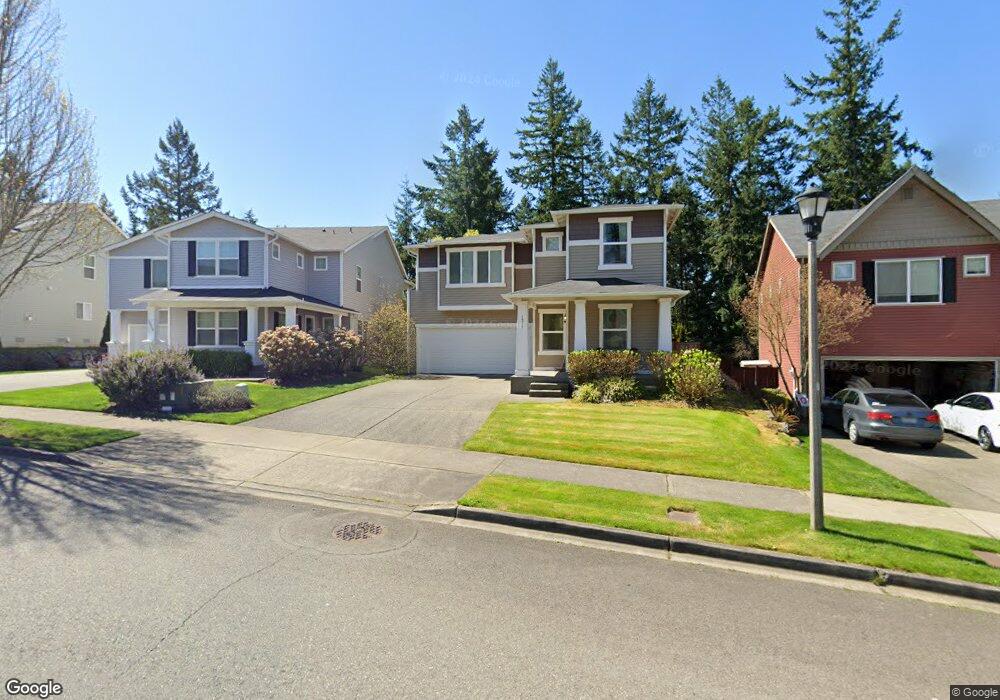
1317 Foreman Rd Dupont, WA 98327
Estimated Value: $607,737 - $658,000
3
Beds
3
Baths
2,678
Sq Ft
$235/Sq Ft
Est. Value
About This Home
This home is located at 1317 Foreman Rd, Dupont, WA 98327 and is currently estimated at $629,434, approximately $235 per square foot. 1317 Foreman Rd is a home located in Pierce County with nearby schools including Chloe Clark Elementary School, Saltars Point Elementary School, and Pioneer Middle School.
Ownership History
Date
Name
Owned For
Owner Type
Purchase Details
Closed on
Feb 2, 2023
Sold by
Kinney Traci Lyn
Bought by
Kinney James Bedford
Current Estimated Value
Purchase Details
Closed on
Jul 27, 2010
Sold by
Kinney Traci and Kinney James B
Bought by
Kinney Traci and Kinney James B
Home Financials for this Owner
Home Financials are based on the most recent Mortgage that was taken out on this home.
Original Mortgage
$333,554
Interest Rate
5.5%
Mortgage Type
FHA
Purchase Details
Closed on
Aug 19, 2008
Sold by
The Quadrant Corp
Bought by
Owen Traci L and Kinney James B
Home Financials for this Owner
Home Financials are based on the most recent Mortgage that was taken out on this home.
Original Mortgage
$334,904
Interest Rate
6.37%
Mortgage Type
Purchase Money Mortgage
Create a Home Valuation Report for This Property
The Home Valuation Report is an in-depth analysis detailing your home's value as well as a comparison with similar homes in the area
Home Values in the Area
Average Home Value in this Area
Purchase History
| Date | Buyer | Sale Price | Title Company |
|---|---|---|---|
| Kinney James Bedford | -- | -- | |
| Kinney Traci | -- | None Available | |
| Owen Traci L | $341,000 | Chicago Title |
Source: Public Records
Mortgage History
| Date | Status | Borrower | Loan Amount |
|---|---|---|---|
| Previous Owner | Kinney Traci | $333,554 | |
| Previous Owner | Owen Traci L | $334,904 |
Source: Public Records
Tax History Compared to Growth
Tax History
| Year | Tax Paid | Tax Assessment Tax Assessment Total Assessment is a certain percentage of the fair market value that is determined by local assessors to be the total taxable value of land and additions on the property. | Land | Improvement |
|---|---|---|---|---|
| 2025 | $4,188 | $568,800 | $229,100 | $339,700 |
| 2024 | $4,188 | $542,100 | $220,700 | $321,400 |
| 2023 | $4,188 | $520,500 | $212,600 | $307,900 |
| 2022 | $4,172 | $530,300 | $212,600 | $317,700 |
| 2021 | $3,958 | $393,200 | $135,100 | $258,100 |
| 2019 | $3,516 | $358,100 | $112,500 | $245,600 |
| 2018 | $3,801 | $343,900 | $112,500 | $231,400 |
| 2017 | $3,412 | $325,700 | $97,800 | $227,900 |
| 2016 | $3,257 | $292,600 | $82,500 | $210,100 |
| 2014 | $3,140 | $289,400 | $82,500 | $206,900 |
| 2013 | $3,140 | $265,300 | $84,100 | $181,200 |
Source: Public Records
Map
Nearby Homes
- 1305 Foreman Rd
- 1335 Foreman Rd
- 1375 Foreman Rd
- 3172 Sheaser Way
- 1162 Swan Loop
- 3178 Hoffman Hill Blvd
- 3572 Hoffman Hill Blvd
- 3073 Hoffman Hill Blvd
- 1061 Hiton Cir
- 3114 Walker Rd
- 2420 Simmons St Unit B
- 2055 Garry Oaks Ave Unit B
- 1975 Garry Oaks Ave Unit C
- 1856 Spencer Ct Unit 12F
- 1607 Kincaid St Unit E-8
- 1680 Kennedy Place Unit A4
- 2176 McDonald Ave
- 2237 Tolmie St
- 2176 Palisade Blvd Unit F-3
- 2147 Hammond Ave Unit B10
- 1315 Foreman Rd
- 1319 Foreman Rd
- 1313 Foreman Rd
- 1321 Foreman Rd
- 1324 Foreman Rd
- 1311 Foreman Rd
- 1323 Foreman Rd
- 1328 Foreman Rd
- 1332 Foreman Rd
- 1309 Foreman Rd
- 1325 Foreman Rd
- 1318 Foreman Rd
- 1334 Foreman Rd
- 1314 Foreman Rd
- 1327 Foreman Rd
- 1307 Foreman Rd
- 1336 Foreman Rd
- 1310 Foreman Rd
- 1329 Foreman Rd
- 1306 Foreman Rd