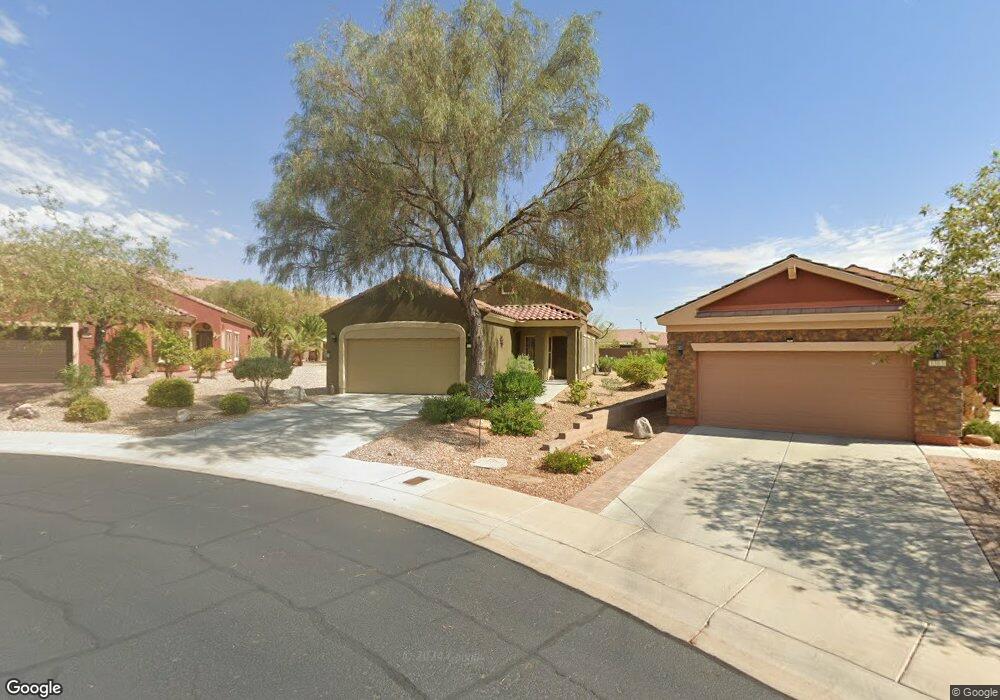
1317 Great Arch Ave Mesquite, NV 89034
Estimated Value: $370,000 - $388,229
2
Beds
2
Baths
1,451
Sq Ft
$261/Sq Ft
Est. Value
About This Home
This home is located at 1317 Great Arch Ave, Mesquite, NV 89034 and is currently estimated at $378,307, approximately $260 per square foot. 1317 Great Arch Ave is a home located in Clark County with nearby schools including Virgin Valley Elementary School, Charles Arthur Hughes Middle School, and Virgin Valley High School.
Ownership History
Date
Name
Owned For
Owner Type
Purchase Details
Closed on
Jun 1, 2023
Sold by
Hammond Rudy R and Hammond Mary L
Bought by
Sock Thomas D and Sirecek-Sock Rene C
Current Estimated Value
Purchase Details
Closed on
Mar 30, 2022
Sold by
Swanger-Jensen Sandra C and Swanger-Jensen Mark D
Bought by
Hammond Rudy R and Hammond Mary L
Home Financials for this Owner
Home Financials are based on the most recent Mortgage that was taken out on this home.
Original Mortgage
$260,000
Interest Rate
3.89%
Mortgage Type
New Conventional
Purchase Details
Closed on
Jun 30, 2008
Sold by
Pn Ii Inc
Bought by
Swanger Jensen Sandra C and Jensen Mark D
Home Financials for this Owner
Home Financials are based on the most recent Mortgage that was taken out on this home.
Original Mortgage
$172,286
Interest Rate
6%
Mortgage Type
Unknown
Create a Home Valuation Report for This Property
The Home Valuation Report is an in-depth analysis detailing your home's value as well as a comparison with similar homes in the area
Home Values in the Area
Average Home Value in this Area
Purchase History
| Date | Buyer | Sale Price | Title Company |
|---|---|---|---|
| Sock Thomas D | $363,269 | Stewart Title | |
| Hammond Rudy R | $400,000 | Stewart Title | |
| Swanger Jensen Sandra C | $229,715 | Lawyers Title Of Nevada Inc |
Source: Public Records
Mortgage History
| Date | Status | Borrower | Loan Amount |
|---|---|---|---|
| Previous Owner | Hammond Rudy R | $260,000 | |
| Previous Owner | Swanger Jensen Sandra C | $172,286 |
Source: Public Records
Tax History Compared to Growth
Tax History
| Year | Tax Paid | Tax Assessment Tax Assessment Total Assessment is a certain percentage of the fair market value that is determined by local assessors to be the total taxable value of land and additions on the property. | Land | Improvement |
|---|---|---|---|---|
| 2025 | $2,520 | $110,219 | $30,800 | $79,419 |
| 2024 | $2,447 | $110,219 | $30,800 | $79,419 |
| 2023 | $2,447 | $102,549 | $27,720 | $74,829 |
| 2022 | $2,376 | $95,185 | $26,758 | $68,427 |
| 2021 | $2,307 | $89,163 | $24,255 | $64,908 |
| 2020 | $2,140 | $84,476 | $20,790 | $63,686 |
| 2019 | $2,006 | $83,399 | $20,790 | $62,609 |
| 2018 | $1,914 | $74,011 | $18,480 | $55,531 |
| 2017 | $1,856 | $65,812 | $15,400 | $50,412 |
| 2016 | $1,790 | $64,726 | $15,400 | $49,326 |
| 2015 | $1,787 | $61,245 | $11,550 | $49,695 |
| 2014 | $1,735 | $60,709 | $11,550 | $49,159 |
Source: Public Records
Map
Nearby Homes
- 757 Bridle Path Ln
- 756 Bridle Path Ln
- 993 Starlight Terrace Way
- 1221 Tortoise Ridge
- 1434 Moonrise Ct
- 1264 Amethyst Aly
- 846 Trickling Brook Ridge
- 1227 Dome Peak Cir
- 988 Majestic View
- 977 Majestic View
- 906 Majestic View
- 1117 Calico Ridge
- 1155 Dreamcatcher Bluff
- 945 Outlook Trail
- 1148 Dreamcatcher Bluff
- 938 Overlook Ln
- Unit 1 Plan at Vista Del Luna
- 479 Apogee Crest St
- 468 Apogee Crest St
- 871 Falcon Glenn Dr
- 1313 Great Arch Ave
- 1139 Grotto Trail
- 1309 Great Arch Ave Unit 4A
- 1135 Grotto Trail
- 1305 Great Arch Ave
- 1131 Grotto Trail
- 1132 Grotto Trail
- 1301 Great Arch Ave
- 1128 Grotto Trail
- 1127 Grotto Trail
- 1402 Chuck Wagon Run
- 1406 Chuck Wagon Run
- 1398 Chuck Wagon Run
- 1398 Chuck Wagon Run
- 1124 Grotto Trail
- 1297 Great Arch Ave
- 1410 Chuck Wagon Run
- 1394 Chuck Wagon Run
- 1123 Grotto Trail
- 1119 Sundial Ln