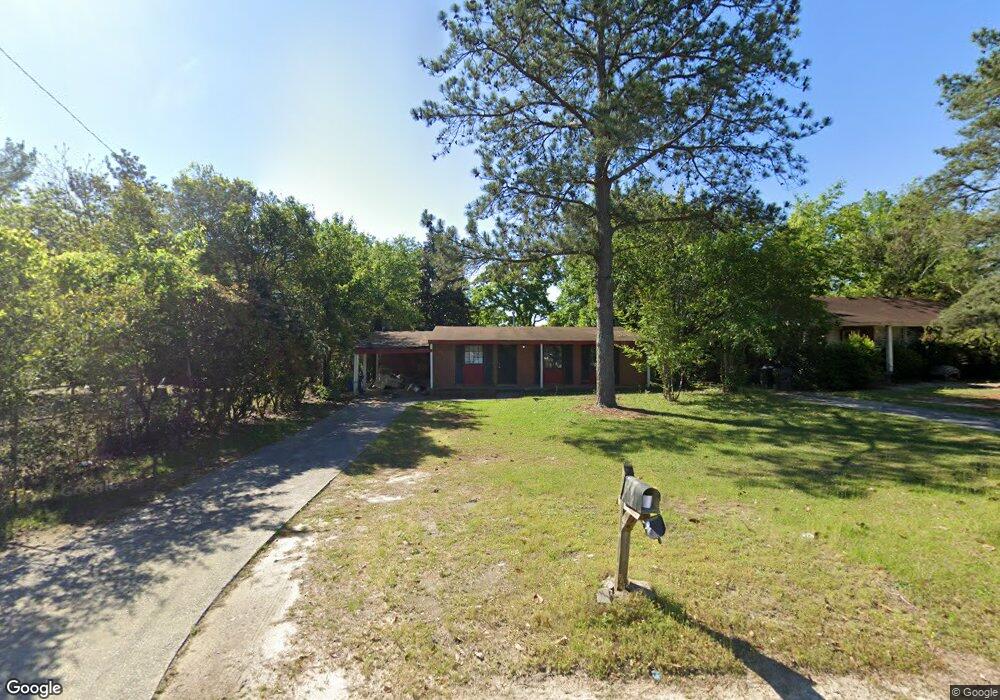
1317 Ross St West Columbia, SC 29169
Estimated Value: $115,000 - $194,035
3
Beds
3
Baths
1,700
Sq Ft
$96/Sq Ft
Est. Value
About This Home
This home is located at 1317 Ross St, West Columbia, SC 29169 and is currently estimated at $163,678, approximately $96 per square foot. 1317 Ross St is a home located in Lexington County with nearby schools including Riverbank Elementary, Northside Middle, and Brookland-Cayce High School.
Ownership History
Date
Name
Owned For
Owner Type
Purchase Details
Closed on
Apr 10, 2023
Sold by
Greenhog Llc
Bought by
Medina Francisco Javier and Perez Alejandra Y
Current Estimated Value
Purchase Details
Closed on
Jun 22, 2016
Sold by
Greenhalgh David
Bought by
Greenhog Llc
Purchase Details
Closed on
Mar 21, 2007
Sold by
Mcguckin Lawrence P and Mcguckin Sandra B
Bought by
Greenhalgh David
Purchase Details
Closed on
Jan 31, 2002
Sold by
Marc Homebuilders Inc
Bought by
Bahal Rashna P
Purchase Details
Closed on
Jan 25, 2002
Sold by
Bank One Na
Bought by
Mcguckin Lawrence P
Purchase Details
Closed on
Oct 22, 2001
Sold by
Master In Equity
Bought by
Bank One Na
Purchase Details
Closed on
Feb 3, 1999
Sold by
Kelley James Eric
Bought by
Crater Stephen C
Purchase Details
Closed on
Feb 2, 1999
Sold by
Carolina Investors Inc
Bought by
Kelley James Eric
Purchase Details
Closed on
Jan 4, 1999
Sold by
Crater Stephen C
Bought by
Purvis John
Create a Home Valuation Report for This Property
The Home Valuation Report is an in-depth analysis detailing your home's value as well as a comparison with similar homes in the area
Home Values in the Area
Average Home Value in this Area
Purchase History
| Date | Buyer | Sale Price | Title Company |
|---|---|---|---|
| Medina Francisco Javier | $98,000 | None Listed On Document | |
| Greenhog Llc | $26,000 | None Available | |
| Greenhalgh David | $62,515 | None Available | |
| Bahal Rashna P | $91,855 | -- | |
| Mcguckin Lawrence P | $22,000 | -- | |
| Bank One Na | $35,227 | -- | |
| Crater Stephen C | $20,250 | -- | |
| Kelley James Eric | $20,000 | -- | |
| Purvis John | $28,000 | -- |
Source: Public Records
Tax History Compared to Growth
Tax History
| Year | Tax Paid | Tax Assessment Tax Assessment Total Assessment is a certain percentage of the fair market value that is determined by local assessors to be the total taxable value of land and additions on the property. | Land | Improvement |
|---|---|---|---|---|
| 2024 | -- | $5,880 | $1,200 | $4,680 |
| 2023 | $1,112 | $3,000 | $600 | $2,400 |
| 2022 | $1,122 | $3,000 | $600 | $2,400 |
| 2020 | $1,063 | $3,000 | $600 | $2,400 |
| 2019 | $1,028 | $2,873 | $480 | $2,393 |
| 2018 | $1,019 | $2,873 | $480 | $2,393 |
| 2017 | $1,000 | $2,873 | $480 | $2,393 |
| 2016 | $1,012 | $2,873 | $480 | $2,393 |
| 2014 | $910 | $2,968 | $480 | $2,488 |
| 2013 | -- | $2,970 | $480 | $2,490 |
Source: Public Records
Map
Nearby Homes
- 638 Carrington Dr
- 1344 Gilmore St
- 1615 Holland St
- 106 Earl Ct
- 324 N Parson St
- 617 Holland Cir
- 1235 Jensen St
- 1513 Gambrell St
- 502A Koon St
- 929-931 Central Dr
- Tract 1 Hallelujah Rd
- 816 Fontanna Ave
- 1452 C Ave
- 1028 Augusta St
- 165 Cavendish Dr
- 1715 Gilvie Ave
- 1734 C Ave
- 1100 Seminole Dr
- 918 N Lucas St
- 916 Mohegan Trail