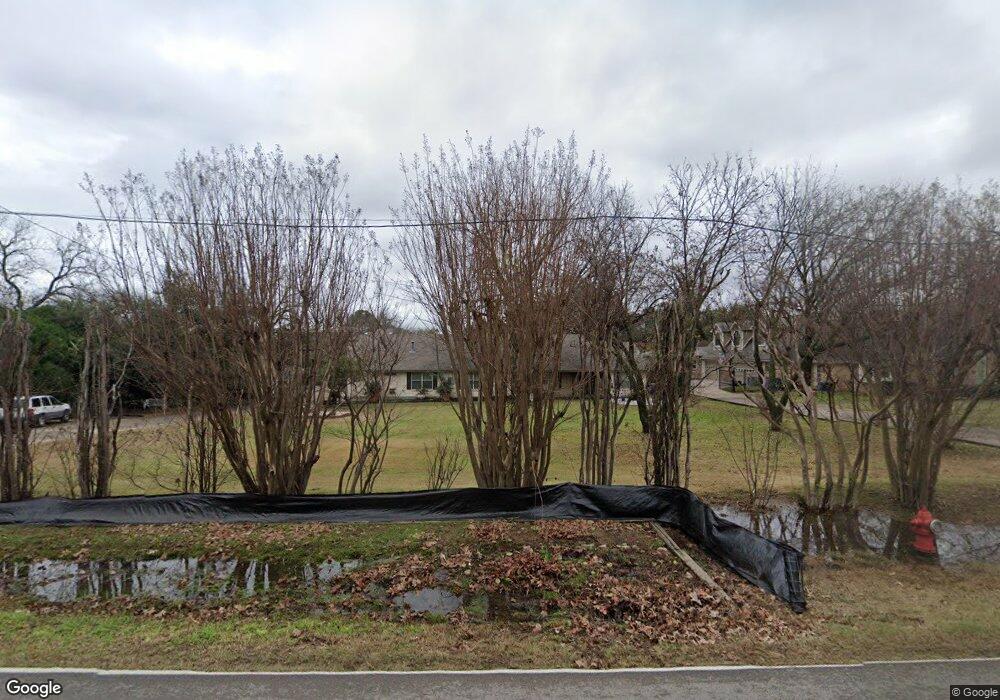
1317 Tinker Rd Colleyville, TX 76034
Estimated Value: $788,498 - $917,000
3
Beds
2
Baths
3,190
Sq Ft
$263/Sq Ft
Est. Value
About This Home
This home is located at 1317 Tinker Rd, Colleyville, TX 76034 and is currently estimated at $839,875, approximately $263 per square foot. 1317 Tinker Rd is a home located in Tarrant County with nearby schools including Colleyville Elementary School, Colleyville Middle School, and Grapevine High School.
Ownership History
Date
Name
Owned For
Owner Type
Purchase Details
Closed on
Sep 11, 2013
Sold by
Forbes Warren Dale
Bought by
Forbes Warren Dale and Forbes Valarie
Current Estimated Value
Home Financials for this Owner
Home Financials are based on the most recent Mortgage that was taken out on this home.
Original Mortgage
$286,000
Outstanding Balance
$145,921
Interest Rate
4.54%
Mortgage Type
Credit Line Revolving
Estimated Equity
$693,954
Purchase Details
Closed on
Jul 19, 2002
Sold by
Forbes Clyde
Bought by
Forbes Warren Dale
Home Financials for this Owner
Home Financials are based on the most recent Mortgage that was taken out on this home.
Original Mortgage
$190,240
Interest Rate
6.47%
Purchase Details
Closed on
Jul 26, 2000
Sold by
Forbes J C and Forbes Annie M
Bought by
Forbes Clyde
Home Financials for this Owner
Home Financials are based on the most recent Mortgage that was taken out on this home.
Original Mortgage
$114,800
Interest Rate
8.23%
Create a Home Valuation Report for This Property
The Home Valuation Report is an in-depth analysis detailing your home's value as well as a comparison with similar homes in the area
Home Values in the Area
Average Home Value in this Area
Purchase History
| Date | Buyer | Sale Price | Title Company |
|---|---|---|---|
| Forbes Warren Dale | -- | None Available | |
| Forbes Warren Dale | -- | Safeco Land Title | |
| Forbes Clyde | -- | Metroplex Title |
Source: Public Records
Mortgage History
| Date | Status | Borrower | Loan Amount |
|---|---|---|---|
| Open | Forbes Warren Dale | $286,000 | |
| Closed | Forbes Warren Dale | $190,240 | |
| Closed | Forbes Clyde | $114,800 |
Source: Public Records
Tax History Compared to Growth
Tax History
| Year | Tax Paid | Tax Assessment Tax Assessment Total Assessment is a certain percentage of the fair market value that is determined by local assessors to be the total taxable value of land and additions on the property. | Land | Improvement |
|---|---|---|---|---|
| 2025 | $3,170 | $657,360 | $278,425 | $378,935 |
| 2024 | $3,170 | $657,360 | $278,425 | $378,935 |
| 2023 | $11,094 | $657,690 | $278,425 | $379,265 |
| 2022 | $12,204 | $617,909 | $278,425 | $339,484 |
| 2021 | $11,312 | $515,122 | $206,850 | $308,272 |
| 2020 | $10,550 | $474,794 | $206,850 | $267,944 |
| 2019 | $9,347 | $404,297 | $206,850 | $197,447 |
| 2018 | $2,077 | $349,361 | $206,850 | $142,511 |
| 2017 | $8,218 | $347,854 | $206,850 | $141,004 |
| 2016 | $7,540 | $319,148 | $203,850 | $115,298 |
| 2015 | $4,391 | $189,500 | $60,000 | $129,500 |
| 2014 | $4,391 | $189,500 | $60,000 | $129,500 |
Source: Public Records
Map
Nearby Homes
- 1315 Hardage Ln
- 1509 Tinker Rd
- 1813 Grosvenor Green
- 6200 Pleasant Run Rd
- 2008 Kyle Ct
- Lot 4 Amelia Ct
- 7005 Whippoorwill Ct
- 5508 Coventry Ct
- 7000 Shalimar Ct
- 1601 Kingswood Ln
- 1305 Bellefonte Ln
- 7012 Shepherds Glen
- 6900 Sir Spencer Ct
- 7200 Belle Meade Dr
- 7106 Belle Meade Dr
- 6602 Charleston Dr
- TBD - Lot 3 John Mccain Rd
- TBD - Lot 1 John Mccain Rd
- 5317 Bluebonnet Dr
- 7001 Colleyville Blvd
- 1315 Tinker Rd
- 1401 Tinker Rd
- 1318 Hardage Ln
- 1314 Hardage Ln
- 1313 Tinker Rd
- 1400 Tinker Rd
- 6209 Ponderosa St
- 1410 Tinker Rd
- 6205 Ponderosa St
- 1312 Hardage Ln
- 1412 Tinker Rd
- 1309 Tinker Rd
- 6201 Ponderosa St
- 6201 Ponderosa St
- 6109 Ponderosa St
- 1308 Hardage Ln
- 6308 Ponderosa Ln
- 6210 Ponderosa St
- 1305 Tinker Rd
- 6208 Ponderosa St