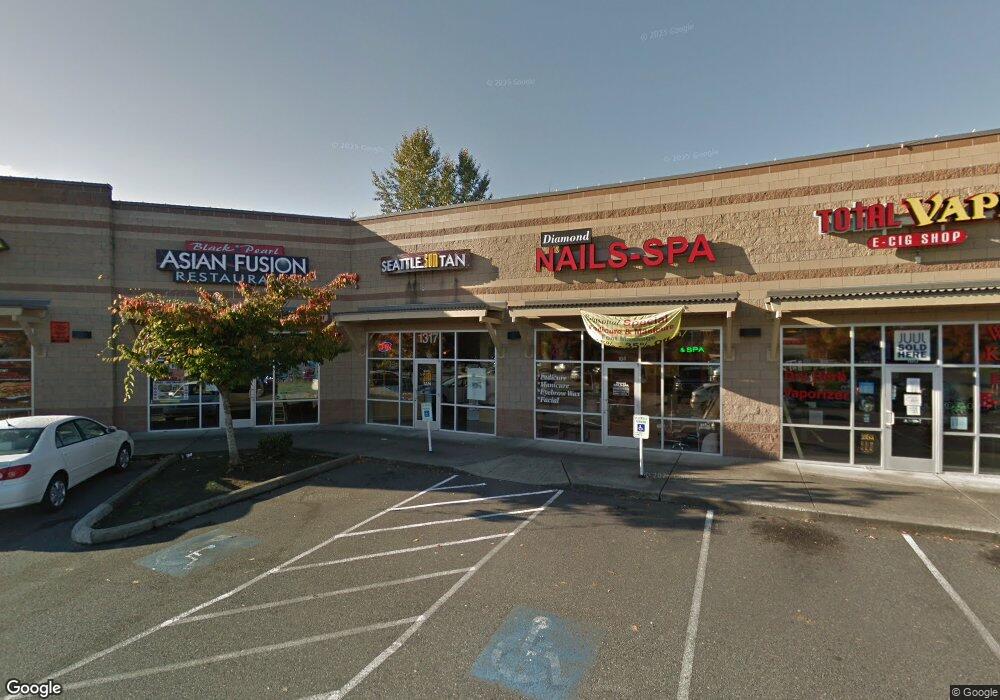
1317 W Bakerview Rd Bellingham, WA 98226
Meridian NeighborhoodEstimated Value: $8,350,287
--
Bed
--
Bath
7,908
Sq Ft
$1,056/Sq Ft
Est. Value
About This Home
This home is located at 1317 W Bakerview Rd, Bellingham, WA 98226 and is currently estimated at $8,350,287, approximately $1,055 per square foot. 1317 W Bakerview Rd is a home located in Whatcom County with nearby schools including Cordata Elementary School, Shuksan Middle School, and Squalicum High School.
Ownership History
Date
Name
Owned For
Owner Type
Purchase Details
Closed on
May 27, 2016
Sold by
Lee Harry J
Bought by
Lee Bakerview Property Llc
Current Estimated Value
Purchase Details
Closed on
Nov 14, 2014
Sold by
Lee Joanne and Lee Harry J
Bought by
Lee Harry J
Purchase Details
Closed on
Jun 20, 2008
Sold by
Bakerview Ventures Llc
Bought by
Easthom Bakerview Llc
Purchase Details
Closed on
Jan 18, 2006
Sold by
Fred Meyer Stores Inc
Bought by
Baker View Ventures Llc
Create a Home Valuation Report for This Property
The Home Valuation Report is an in-depth analysis detailing your home's value as well as a comparison with similar homes in the area
Home Values in the Area
Average Home Value in this Area
Purchase History
| Date | Buyer | Sale Price | Title Company |
|---|---|---|---|
| Lee Bakerview Property Llc | -- | None Available | |
| Lee Harry J | -- | Chicago Title Insurance | |
| Lee Harry J | $3,400,000 | Chicago Title Insurance | |
| Easthom Bakerview Llc | $3,725,280 | Chicago Title Insurance | |
| Baker View Ventures Llc | $450,280 | First American Title Insuran |
Source: Public Records
Tax History Compared to Growth
Tax History
| Year | Tax Paid | Tax Assessment Tax Assessment Total Assessment is a certain percentage of the fair market value that is determined by local assessors to be the total taxable value of land and additions on the property. | Land | Improvement |
|---|---|---|---|---|
| 2024 | $24,165 | $3,107,389 | $1,551,946 | $1,555,443 |
| 2023 | $24,165 | $3,107,389 | $1,551,946 | $1,555,443 |
| 2022 | $25,390 | $3,170,804 | $1,583,618 | $1,587,186 |
| 2021 | $28,311 | $2,733,452 | $1,365,188 | $1,368,264 |
| 2020 | $29,290 | $2,876,553 | $1,723,658 | $1,152,895 |
| 2019 | $25,590 | $2,876,553 | $1,723,658 | $1,152,895 |
| 2018 | $28,477 | $2,519,816 | $1,509,898 | $1,009,918 |
| 2017 | $22,506 | $2,397,477 | $1,436,591 | $960,886 |
| 2016 | $20,737 | $1,980,197 | $1,123,586 | $856,611 |
| 2015 | $19,847 | $1,899,469 | $1,077,780 | $821,689 |
| 2014 | -- | $1,758,998 | $1,023,891 | $735,107 |
| 2013 | -- | $1,758,998 | $1,023,891 | $735,107 |
Source: Public Records
Map
Nearby Homes
- 1217 Garland Ln
- 1365 Mahogany Ave
- 0 Home Ln
- 1360 Talus Way
- 1366 Talus Way
- 1368 Talus Way
- 1370 Talus Way
- 4154 Pacific Hwy
- 4226 Melrose Ln
- 4230 Melrose Ln
- 4232 Melrose Ln
- 4228 Melrose Ln
- 44 XX Pacific Hwy
- 4225 Ambrosia Ln
- 4227 Ambrosia Ln
- 4229 Ambrosia Ln
- 4231 Ambrosia Ln
- 3085 W Maplewood Ave
- 4434 Pacific Hwy
- 4252 Northwest Dr
- 1317 W Bakerview Rd Unit 102
- 1427 W Bakerview Rd
- 1237 W Bakerview Rd
- 4017 Bakerview Spur
- 1235 W Bakerview Rd
- 4018 Pacific Hwy
- 4033 Pacific Hwy
- 1240 W Bakerview Rd
- 1210 W Bakerview Rd
- 4054 Pacific Hwy
- 1348 W Bakerview Rd
- 4072 Pacific Hwy
- 1120 W Bakerview Rd
- 1075 W Bakerview Rd
- 4157 Dover St
- 4161 Dover St
- 1065 W Bakerview Rd
- 4160 Dover St
- 1063 W Bakerview Rd
- 4084 Pacific Hwy