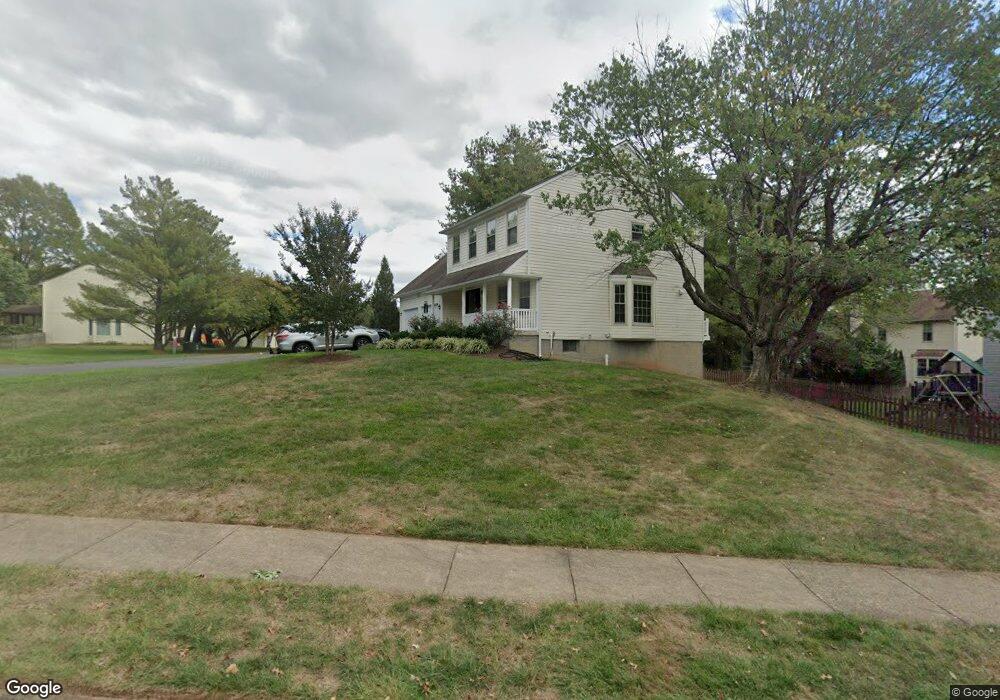
13173 Ruby Lace Ct Herndon, VA 20171
Oak Hill NeighborhoodEstimated Value: $836,000 - $1,023,000
5
Beds
5
Baths
1,920
Sq Ft
$467/Sq Ft
Est. Value
About This Home
This home is located at 13173 Ruby Lace Ct, Herndon, VA 20171 and is currently estimated at $897,463, approximately $467 per square foot. 13173 Ruby Lace Ct is a home located in Fairfax County with nearby schools including Oak Hill Elementary School, Rachel Carson Middle School, and Westfield High School.
Ownership History
Date
Name
Owned For
Owner Type
Purchase Details
Closed on
Mar 10, 2018
Sold by
Malkani Manish and Malkani Shikha
Bought by
Malkani Manish and Malkani Shikha
Current Estimated Value
Purchase Details
Closed on
Nov 27, 2006
Sold by
Weisse David F
Bought by
Malkani Manish and Sawhney,Shikha
Home Financials for this Owner
Home Financials are based on the most recent Mortgage that was taken out on this home.
Original Mortgage
$385,000
Outstanding Balance
$231,202
Interest Rate
6.39%
Mortgage Type
New Conventional
Estimated Equity
$666,261
Purchase Details
Closed on
May 12, 2004
Sold by
Clark Darrell J
Bought by
Weisse David F
Home Financials for this Owner
Home Financials are based on the most recent Mortgage that was taken out on this home.
Original Mortgage
$390,000
Interest Rate
5.47%
Mortgage Type
New Conventional
Purchase Details
Closed on
Apr 18, 2000
Sold by
Amey William Scott
Bought by
Clark Darrell J
Home Financials for this Owner
Home Financials are based on the most recent Mortgage that was taken out on this home.
Original Mortgage
$215,200
Interest Rate
8.21%
Create a Home Valuation Report for This Property
The Home Valuation Report is an in-depth analysis detailing your home's value as well as a comparison with similar homes in the area
Home Values in the Area
Average Home Value in this Area
Purchase History
| Date | Buyer | Sale Price | Title Company |
|---|---|---|---|
| Malkani Manish | -- | None Available | |
| Malkani Manish | $545,000 | -- | |
| Weisse David F | $490,000 | -- | |
| Clark Darrell J | $269,000 | -- |
Source: Public Records
Mortgage History
| Date | Status | Borrower | Loan Amount |
|---|---|---|---|
| Open | Malkani Manish | $385,000 | |
| Previous Owner | Weisse David F | $390,000 | |
| Previous Owner | Clark Darrell J | $215,200 |
Source: Public Records
Tax History
| Year | Tax Paid | Tax Assessment Tax Assessment Total Assessment is a certain percentage of the fair market value that is determined by local assessors to be the total taxable value of land and additions on the property. | Land | Improvement |
|---|---|---|---|---|
| 2025 | $8,479 | $797,070 | $321,000 | $476,070 |
| 2024 | $8,479 | $731,900 | $301,000 | $430,900 |
| 2023 | $8,047 | $713,100 | $291,000 | $422,100 |
| 2022 | $7,811 | $683,040 | $266,000 | $417,040 |
| 2021 | $7,110 | $605,880 | $241,000 | $364,880 |
| 2020 | $6,708 | $566,780 | $241,000 | $325,780 |
| 2019 | $6,578 | $555,810 | $236,000 | $319,810 |
| 2018 | $6,208 | $539,830 | $226,000 | $313,830 |
| 2017 | $6,189 | $533,070 | $224,000 | $309,070 |
| 2016 | $5,921 | $511,070 | $211,000 | $300,070 |
Source: Public Records
Map
Nearby Homes
- 13141 Ladybank Ln
- 13142 New Parkland Dr
- 13505 Coates Ln
- 2781 Middleton Farm Ct
- 13512 Apple Barrel Ct
- 13050 Monterey Estates Dr
- 12814 Pinecrest Rd
- 13002 New Arden Ct
- 3160 John Glenn St Unit 505
- 13723 Neil Armstrong Ave Unit 503
- 13139 Applegrove Ln
- 2626 Armada St
- 2700 Reign St
- 12914 Percheron Ln
- 13110 Thompson Rd
- 13103 Anvil Place
- 3350 Oakshade Ct
- 3346 Oakshade Ct
- 3623 Great Laurel Ln
- 12321 Folkstone Dr
- 13171 Ruby Lace Ct
- 3013 Emerald Chase Dr
- 13163 Ruby Lace Ct
- 3015 Emerald Chase Dr
- 13165 Ruby Lace Ct
- 13172 Ruby Lace Ct
- 3017 Emerald Chase Dr
- 13169 Ruby Lace Ct
- 13170 Ruby Lace Ct
- 13167 Ruby Lace Ct
- 3007 Emerald Chase Dr
- 13161 Ruby Lace Ct
- 13162 Ruby Lace Ct
- 3019 Emerald Chase Dr
- 13160 Ruby Lace Ct
- 3012 Emerald Chase Dr
- 3005 Emerald Chase Dr
- 13159 Ruby Lace Ct
- 3014 Emerald Chase Dr
- 3010 Emerald Chase Dr
Your Personal Tour Guide
Ask me questions while you tour the home.