1318 12th St W West Fargo, ND 58078
Estimated Value: $273,000 - $296,081
3
Beds
3
Baths
1,800
Sq Ft
$158/Sq Ft
Est. Value
About This Home
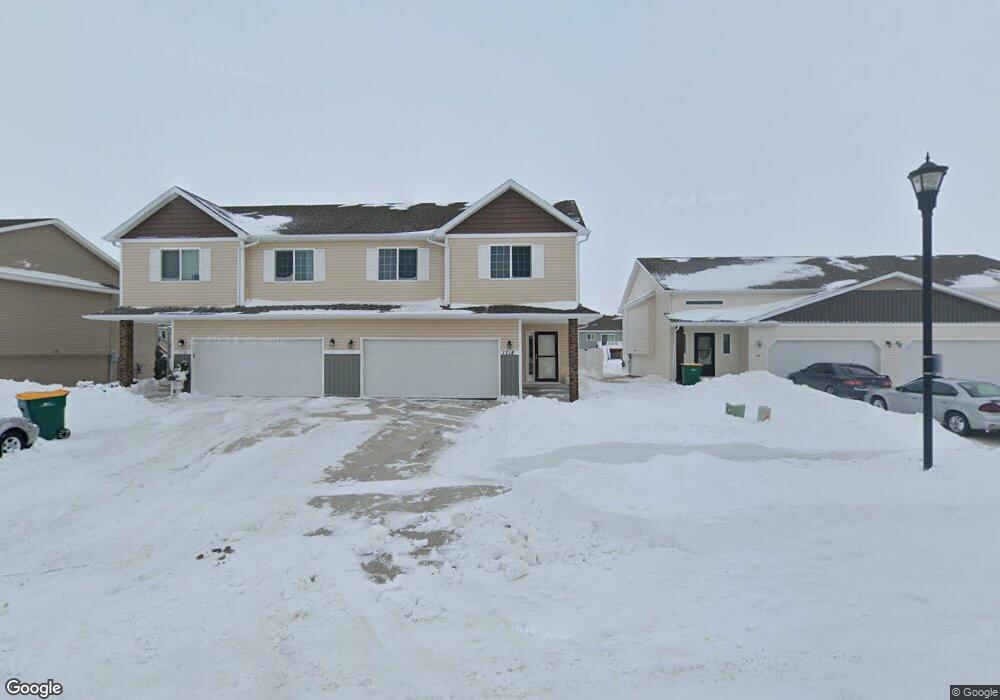
This home is located at 1318 12th St W, West Fargo, ND 58078 and is currently estimated at $284,541, approximately $158 per square foot. 1318 12th St W is a home located in Cass County with nearby schools including Westside Elementary School, Cheney Middle School, and West Fargo High School.
Ownership History
Date
Name
Owned For
Owner Type
Purchase Details
Closed on
Jul 10, 2017
Sold by
Riley Nelson Rilcy J and Riley Nelson
Bought by
Nelson Riley J and Yochim Ashley M
Current Estimated Value
Home Financials for this Owner
Home Financials are based on the most recent Mortgage that was taken out on this home.
Original Mortgage
$162,750
Outstanding Balance
$135,403
Interest Rate
3.94%
Mortgage Type
New Conventional
Estimated Equity
$149,138
Purchase Details
Closed on
Oct 2, 2014
Sold by
Jordahl Custom Homes Inc
Bought by
Nelson Riley
Purchase Details
Closed on
Sep 21, 2014
Sold by
J & O Real Estate Llc
Bought by
Jordahl Custom Homes Inc
Purchase Details
Closed on
Apr 25, 2014
Sold by
Beaton Violet F and Beaton Perry
Bought by
J & O Real Estate Llc
Purchase Details
Closed on
Apr 22, 2014
Sold by
Beaton Perry T and Estate Of Wallace A Beaton
Bought by
Beaton Perry T and Beaton Jay P
Create a Home Valuation Report for This Property
The Home Valuation Report is an in-depth analysis detailing your home's value as well as a comparison with similar homes in the area
Home Values in the Area
Average Home Value in this Area
Purchase History
| Date | Buyer | Sale Price | Title Company |
|---|---|---|---|
| Nelson Riley J | -- | Plains Title Llc | |
| Nelson Riley | $165,621 | U S Title | |
| Jordahl Custom Homes Inc | -- | None Available | |
| Jordahl Custom Homes Inc | $9,000 | None Available | |
| J & O Real Estate Llc | -- | Northern Title Co | |
| Beaton Perry T | -- | Northern Title Co |
Source: Public Records
Mortgage History
| Date | Status | Borrower | Loan Amount |
|---|---|---|---|
| Open | Nelson Riley J | $162,750 |
Source: Public Records
Tax History Compared to Growth
Tax History
| Year | Tax Paid | Tax Assessment Tax Assessment Total Assessment is a certain percentage of the fair market value that is determined by local assessors to be the total taxable value of land and additions on the property. | Land | Improvement |
|---|---|---|---|---|
| 2024 | $4,847 | $133,050 | $18,800 | $114,250 |
| 2023 | $4,601 | $125,350 | $18,800 | $106,550 |
| 2022 | $4,502 | $115,500 | $18,800 | $96,700 |
| 2021 | $4,366 | $106,150 | $15,050 | $91,100 |
| 2020 | $4,199 | $103,550 | $15,050 | $88,500 |
| 2019 | $3,932 | $97,750 | $15,050 | $82,700 |
| 2018 | $3,862 | $98,600 | $15,050 | $83,550 |
| 2017 | $3,673 | $94,700 | $15,050 | $79,650 |
| 2016 | $1,641 | $16,450 | $15,050 | $1,400 |
| 2015 | $1,278 | $7,750 | $7,750 | $0 |
| 2014 | $205 | $7,750 | $7,750 | $0 |
| 2013 | -- | $0 | $0 | $0 |
Source: Public Records
Map
Nearby Homes