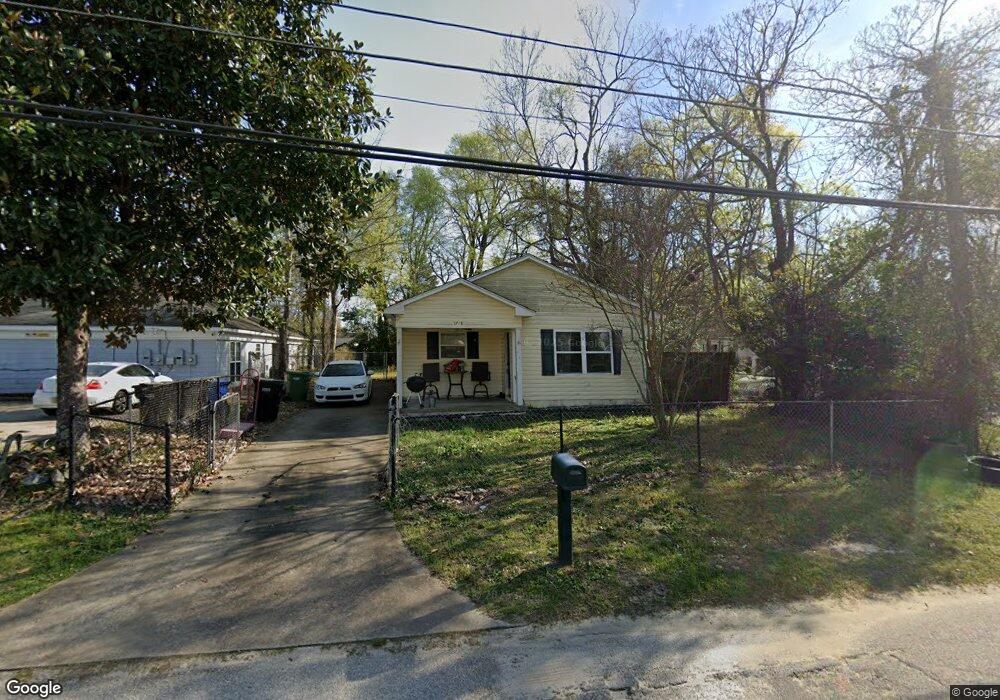
1318 24th St Columbus, GA 31901
East Highlands NeighborhoodEstimated Value: $113,389 - $146,000
4
Beds
3
Baths
1,203
Sq Ft
$109/Sq Ft
Est. Value
About This Home
This home is located at 1318 24th St, Columbus, GA 31901 and is currently estimated at $131,597, approximately $109 per square foot. 1318 24th St is a home located in Muscogee County with nearby schools including Hannan Elementary School, Arnold Middle School, and Jordan Vocational High School.
Ownership History
Date
Name
Owned For
Owner Type
Purchase Details
Closed on
Mar 23, 2017
Sold by
St Clair Billy
Bought by
Soler Selina M
Current Estimated Value
Home Financials for this Owner
Home Financials are based on the most recent Mortgage that was taken out on this home.
Original Mortgage
$70,300
Outstanding Balance
$58,280
Interest Rate
4.16%
Mortgage Type
New Conventional
Estimated Equity
$73,317
Create a Home Valuation Report for This Property
The Home Valuation Report is an in-depth analysis detailing your home's value as well as a comparison with similar homes in the area
Home Values in the Area
Average Home Value in this Area
Purchase History
| Date | Buyer | Sale Price | Title Company |
|---|---|---|---|
| Soler Selina M | $74,000 | -- |
Source: Public Records
Mortgage History
| Date | Status | Borrower | Loan Amount |
|---|---|---|---|
| Open | Soler Selina M | $70,300 |
Source: Public Records
Tax History Compared to Growth
Tax History
| Year | Tax Paid | Tax Assessment Tax Assessment Total Assessment is a certain percentage of the fair market value that is determined by local assessors to be the total taxable value of land and additions on the property. | Land | Improvement |
|---|---|---|---|---|
| 2025 | $1,387 | $35,444 | $7,756 | $27,688 |
| 2024 | $1,387 | $35,444 | $7,756 | $27,688 |
| 2023 | $1,396 | $35,444 | $7,756 | $27,688 |
| 2022 | $1,231 | $30,144 | $7,756 | $22,388 |
| 2021 | $1,320 | $32,324 | $7,756 | $24,568 |
| 2020 | $1,320 | $32,324 | $7,756 | $24,568 |
| 2019 | $1,324 | $32,324 | $7,756 | $24,568 |
| 2018 | $1,213 | $29,600 | $7,080 | $22,520 |
| 2017 | $343 | $35,252 | $9,696 | $25,556 |
| 2016 | $346 | $21,656 | $3,600 | $18,056 |
| 2015 | $139 | $21,656 | $3,600 | $18,056 |
| 2014 | $139 | $21,656 | $3,600 | $18,056 |
| 2013 | -- | $21,656 | $3,600 | $18,056 |
Source: Public Records
Map
Nearby Homes