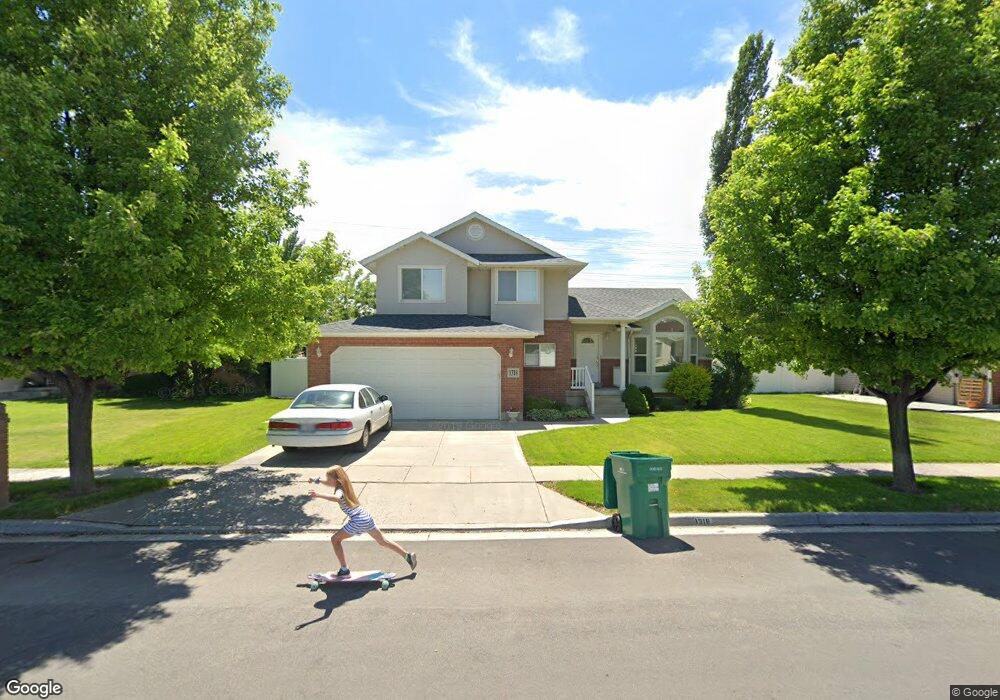
1318 Bridgecreek Ln Layton, UT 84041
Estimated Value: $557,473 - $623,000
4
Beds
4
Baths
1,916
Sq Ft
$303/Sq Ft
Est. Value
About This Home
This home is located at 1318 Bridgecreek Ln, Layton, UT 84041 and is currently estimated at $579,618, approximately $302 per square foot. 1318 Bridgecreek Ln is a home with nearby schools including Heritage Elementary School, Shoreline Junior High School, and Davis High School.
Ownership History
Date
Name
Owned For
Owner Type
Purchase Details
Closed on
Apr 20, 2020
Sold by
Stringham Scott R and Stringham Heidi S
Bought by
Prinster Shaun and Prinster Jennifer
Current Estimated Value
Home Financials for this Owner
Home Financials are based on the most recent Mortgage that was taken out on this home.
Original Mortgage
$188,000
Outstanding Balance
$166,229
Interest Rate
3.3%
Mortgage Type
New Conventional
Estimated Equity
$413,389
Purchase Details
Closed on
Jan 21, 1999
Sold by
Advantage Communities Inc
Bought by
Stringham Scott R and Stringham Heidi S
Home Financials for this Owner
Home Financials are based on the most recent Mortgage that was taken out on this home.
Original Mortgage
$144,000
Interest Rate
6.63%
Create a Home Valuation Report for This Property
The Home Valuation Report is an in-depth analysis detailing your home's value as well as a comparison with similar homes in the area
Home Values in the Area
Average Home Value in this Area
Purchase History
| Date | Buyer | Sale Price | Title Company |
|---|---|---|---|
| Prinster Shaun | -- | North American Title | |
| Stringham Scott R | -- | Associated Title Company |
Source: Public Records
Mortgage History
| Date | Status | Borrower | Loan Amount |
|---|---|---|---|
| Open | Prinster Shaun | $188,000 | |
| Previous Owner | Stringham Scott R | $144,000 | |
| Closed | Stringham Scott R | $6,386 |
Source: Public Records
Tax History Compared to Growth
Tax History
| Year | Tax Paid | Tax Assessment Tax Assessment Total Assessment is a certain percentage of the fair market value that is determined by local assessors to be the total taxable value of land and additions on the property. | Land | Improvement |
|---|---|---|---|---|
| 2025 | $2,730 | $286,550 | $101,278 | $185,272 |
| 2024 | $2,642 | $279,400 | $110,535 | $168,865 |
| 2023 | $2,650 | $494,000 | $112,391 | $381,609 |
| 2022 | $2,804 | $283,800 | $68,255 | $215,545 |
| 2021 | $2,630 | $397,000 | $102,390 | $294,610 |
| 2020 | $2,362 | $342,000 | $86,673 | $255,327 |
| 2019 | $2,277 | $323,000 | $87,697 | $235,303 |
| 2018 | $2,261 | $322,000 | $77,053 | $244,947 |
| 2016 | $2,043 | $150,040 | $36,354 | $113,686 |
| 2015 | $2,054 | $143,220 | $36,354 | $106,866 |
| 2014 | $2,114 | $150,757 | $36,354 | $114,403 |
| 2013 | -- | $121,164 | $28,952 | $92,212 |
Source: Public Records
Map
Nearby Homes
- 1494 S Mica Ln
- Creighton Farmhouse Plan at Angel Hill
- 1278 S Grace Way
- Aspen Plan at West Gate
- Eleanor Plan at West Gate
- McKinley Plan at West Gate
- Harrison Plan at West Gate
- Redwood Plan at West Gate
- Alpine - WG Plan at West Gate
- Cottonwood Plan at West Gate
- Linden Plan at West Gate
- Columbia Plan at West Gate
- Roosevelt Plan at West Gate
- Yukon Plan at West Gate
- Spruce Pantry Plan at West Gate
- Sequoia Plan at West Gate
- Basswood Plan at West Gate
- Madison Plan at West Gate
- Charles Plan at West Gate
- Sycamore Plan at West Gate
- 1334 Bridgecreek Ln
- 1304 Bridgecreek Ln
- 1301 Bridgecreek Ln
- 1329 Bridgecreek Ln
- 1346 Bridgecreek Ln
- 1284 Bridgecreek Ln
- 1325 W Granite Dr Unit 326
- 1325 W Granite Dr
- 1360 Bridgecreek Ln
- 1360 Bridgecreek Ln Unit 419
- 1298 Bridge Park Way
- 1359 W Bridgecreek Ln
- 1297 W Bridge Park Unit 413
- 1342 W Granite Dr
- 1311 W Granite Dr
- 1272 Bridgecreek Ln Unit 158
- 1272 Bridgecreek Ln
- 1286 Bridge Park Way
- 1374 Bridgecreek Ln Unit 418
- 1374 Bridgecreek Ln Unit 418