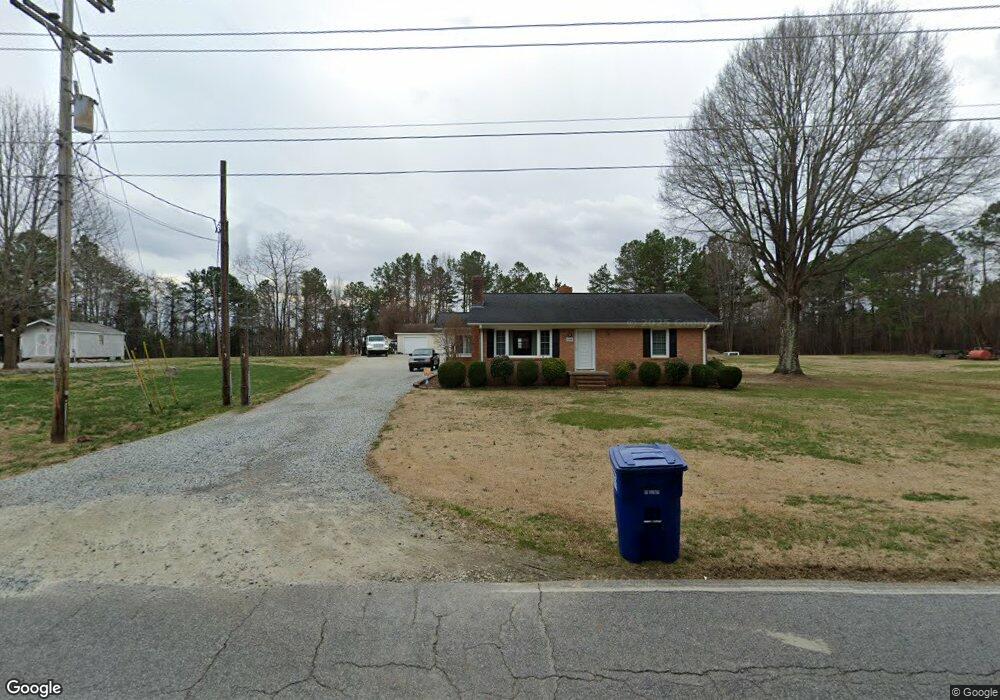
1318 Cox Ave High Point, NC 27263
Estimated Value: $142,000 - $202,045
2
Beds
1
Bath
1,236
Sq Ft
$145/Sq Ft
Est. Value
About This Home
This home is located at 1318 Cox Ave, High Point, NC 27263 and is currently estimated at $179,011, approximately $144 per square foot. 1318 Cox Ave is a home located in Guilford County with nearby schools including Allen Jay Elementary School, Southern Guilford Middle, and Southern Guilford High School.
Ownership History
Date
Name
Owned For
Owner Type
Purchase Details
Closed on
Aug 5, 2011
Sold by
Gore Lisa R
Bought by
Gore Brian K
Current Estimated Value
Home Financials for this Owner
Home Financials are based on the most recent Mortgage that was taken out on this home.
Original Mortgage
$100,000
Outstanding Balance
$69,077
Interest Rate
4.52%
Mortgage Type
Credit Line Revolving
Estimated Equity
$109,934
Purchase Details
Closed on
Dec 19, 2006
Sold by
Linder Eleanor C and Linder John Lee
Bought by
Gore Brian K and Gore Lisa R
Purchase Details
Closed on
Nov 19, 1990
Bought by
Gore Brian K
Create a Home Valuation Report for This Property
The Home Valuation Report is an in-depth analysis detailing your home's value as well as a comparison with similar homes in the area
Home Values in the Area
Average Home Value in this Area
Purchase History
| Date | Buyer | Sale Price | Title Company |
|---|---|---|---|
| Gore Brian K | -- | Chicago Title Insurance Co | |
| Gore Brian K | -- | None Available | |
| Gore Brian K | $57,000 | -- |
Source: Public Records
Mortgage History
| Date | Status | Borrower | Loan Amount |
|---|---|---|---|
| Open | Gore Brian K | $100,000 |
Source: Public Records
Tax History
| Year | Tax Paid | Tax Assessment Tax Assessment Total Assessment is a certain percentage of the fair market value that is determined by local assessors to be the total taxable value of land and additions on the property. | Land | Improvement |
|---|---|---|---|---|
| 2025 | $1,090 | $124,300 | $20,000 | $104,300 |
| 2024 | $1,090 | $124,300 | $20,000 | $104,300 |
| 2023 | $1,090 | $124,300 | $20,000 | $104,300 |
| 2022 | $1,090 | $124,300 | $20,000 | $104,300 |
| 2021 | $966 | $110,100 | $20,000 | $90,100 |
| 2020 | $966 | $110,100 | $20,000 | $90,100 |
| 2019 | $853 | $97,300 | $0 | $0 |
| 2018 | $849 | $97,300 | $0 | $0 |
| 2017 | $823 | $97,300 | $0 | $0 |
| 2016 | $784 | $89,600 | $0 | $0 |
| 2015 | $788 | $89,600 | $0 | $0 |
| 2014 | $797 | $89,600 | $0 | $0 |
Source: Public Records
Map
Nearby Homes
- 1501 Cox Ct
- 1900-1922 Baker Rd
- 1105 E Springfield Rd
- 914 Nance Ave
- 919 Belmont Dr
- 1535 E Fairfield Rd
- 3003 #REAR Oakcrest Ave
- 717 Belmont Dr
- 928 Marlboro St
- 921 Norton St
- 3630 Southpark Dr
- 3304 Central Ave
- 1638 Kersey Valley Rd
- 611 Liberty Rd
- 000 Liberty Rd
- 930 & 928 R1 Marlboro St
- 210 Paramount St
- 715 Baker Rd
- 600 E Fairfield Rd
- 609 Martha Place
Your Personal Tour Guide
Ask me questions while you tour the home.