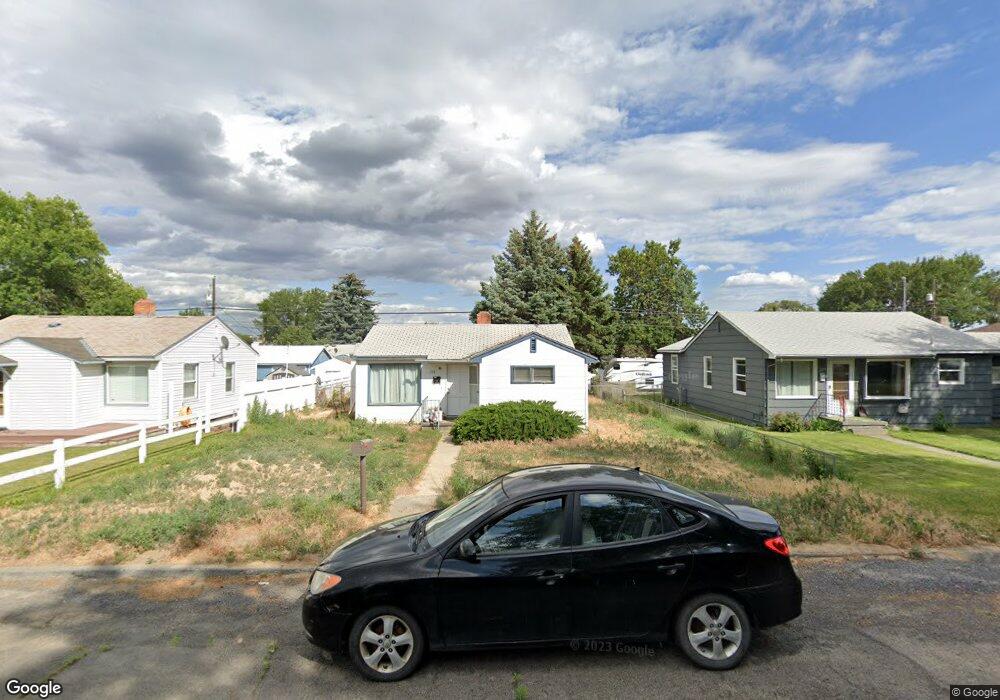
1318 D St SW Ephrata, WA 98823
Estimated Value: $184,000 - $234,000
2
Beds
1
Bath
684
Sq Ft
$298/Sq Ft
Est. Value
About This Home
This home is located at 1318 D St SW, Ephrata, WA 98823 and is currently estimated at $203,613, approximately $297 per square foot. 1318 D St SW is a home located in Grant County with nearby schools including Ephrata High School, New Life Christian School, and St. Rose of Lima Catholic School.
Ownership History
Date
Name
Owned For
Owner Type
Purchase Details
Closed on
May 18, 2017
Sold by
Miranda Frank V and Greenpoint Mortgage Funding In
Bought by
Thompson Derek
Current Estimated Value
Purchase Details
Closed on
Jun 1, 2007
Sold by
Miranda Griselda
Bought by
Miranda Frank
Home Financials for this Owner
Home Financials are based on the most recent Mortgage that was taken out on this home.
Original Mortgage
$76,000
Interest Rate
6.14%
Mortgage Type
Purchase Money Mortgage
Create a Home Valuation Report for This Property
The Home Valuation Report is an in-depth analysis detailing your home's value as well as a comparison with similar homes in the area
Home Values in the Area
Average Home Value in this Area
Purchase History
| Date | Buyer | Sale Price | Title Company |
|---|---|---|---|
| Thompson Derek | $54,001 | None Available | |
| Miranda Frank | -- | Chicago Title Ins Co | |
| Miranda Frank | $80,350 | Chicago Title Ins Co |
Source: Public Records
Mortgage History
| Date | Status | Borrower | Loan Amount |
|---|---|---|---|
| Previous Owner | Miranda Frank | $76,000 |
Source: Public Records
Tax History Compared to Growth
Tax History
| Year | Tax Paid | Tax Assessment Tax Assessment Total Assessment is a certain percentage of the fair market value that is determined by local assessors to be the total taxable value of land and additions on the property. | Land | Improvement |
|---|---|---|---|---|
| 2024 | $779 | $68,222 | $20,000 | $48,222 |
| 2023 | $973 | $75,255 | $20,000 | $55,255 |
| 2022 | $946 | $75,255 | $20,000 | $55,255 |
| 2021 | $886 | $75,255 | $20,000 | $55,255 |
| 2020 | $847 | $67,290 | $20,000 | $47,290 |
| 2019 | $600 | $55,875 | $20,000 | $35,875 |
| 2018 | $890 | $61,065 | $16,000 | $45,065 |
| 2017 | $748 | $54,630 | $16,000 | $38,630 |
| 2016 | $678 | $45,860 | $16,000 | $29,860 |
| 2013 | -- | $42,235 | $16,000 | $26,235 |
Source: Public Records
Map
Nearby Homes