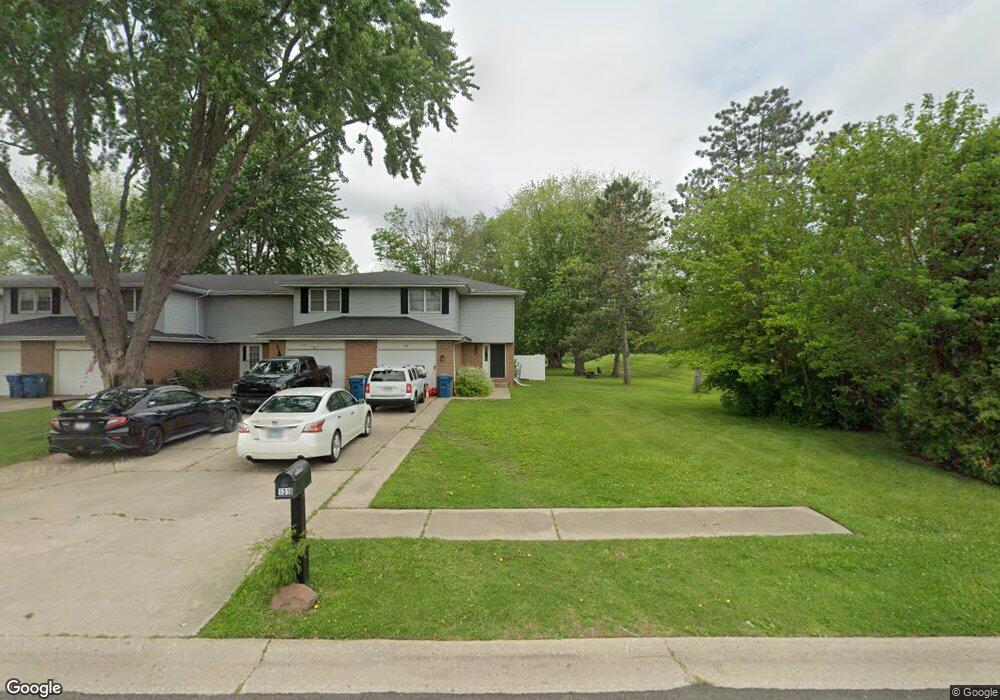
1318 Deerpath Dr Unit 1 Morris, IL 60450
Estimated Value: $230,000 - $242,643
3
Beds
2
Baths
1,340
Sq Ft
$176/Sq Ft
Est. Value
About This Home
This home is located at 1318 Deerpath Dr Unit 1, Morris, IL 60450 and is currently estimated at $235,911, approximately $176 per square foot. 1318 Deerpath Dr Unit 1 is a home located in Grundy County with nearby schools including White Oak Elementary School, Shabbona Middle School, and Morris Community High School.
Ownership History
Date
Name
Owned For
Owner Type
Purchase Details
Closed on
May 9, 2018
Sold by
Eisenhower Paulina
Bought by
Tuley Amy and Swanson Matthew
Current Estimated Value
Home Financials for this Owner
Home Financials are based on the most recent Mortgage that was taken out on this home.
Original Mortgage
$141,882
Outstanding Balance
$124,792
Interest Rate
5.38%
Mortgage Type
FHA
Estimated Equity
$111,119
Purchase Details
Closed on
Oct 30, 2017
Sold by
Eishnhower Megan M
Bought by
Eisenhower Paulina
Purchase Details
Closed on
Sep 5, 2012
Sold by
Ellen M Ellen M
Bought by
Freer Ellen M and Sullivan Timothy D
Purchase Details
Closed on
May 3, 2012
Sold by
Richard K Richard K and Cunningham Linda A
Bought by
Freer Ellen M
Create a Home Valuation Report for This Property
The Home Valuation Report is an in-depth analysis detailing your home's value as well as a comparison with similar homes in the area
Purchase History
| Date | Buyer | Sale Price | Title Company |
|---|---|---|---|
| Tuley Amy | $144,500 | Chicago Title | |
| Eisenhower Paulina | -- | -- | |
| Freer Ellen M | -- | -- | |
| Freer Ellen M | -- | Chicago Title Insurance |
Source: Public Records
Mortgage History
| Date | Status | Borrower | Loan Amount |
|---|---|---|---|
| Open | Tuley Amy | $141,882 |
Source: Public Records
Tax History
| Year | Tax Paid | Tax Assessment Tax Assessment Total Assessment is a certain percentage of the fair market value that is determined by local assessors to be the total taxable value of land and additions on the property. | Land | Improvement |
|---|---|---|---|---|
| 2024 | $4,601 | $58,787 | $14,532 | $44,255 |
| 2023 | $4,333 | $55,365 | $13,686 | $41,679 |
| 2022 | $3,527 | $51,065 | $12,623 | $38,442 |
| 2021 | $3,357 | $48,293 | $11,938 | $36,355 |
| 2020 | $3,306 | $47,060 | $11,633 | $35,427 |
| 2019 | $3,091 | $44,607 | $11,027 | $33,580 |
| 2018 | $3,034 | $43,742 | $10,813 | $32,929 |
| 2017 | $2,831 | $41,442 | $10,244 | $31,198 |
| 2016 | $2,800 | $41,117 | $10,164 | $30,953 |
| 2015 | $2,602 | $39,471 | $9,757 | $29,714 |
| 2014 | $2,526 | $38,440 | $9,502 | $28,938 |
| 2013 | -- | $39,970 | $9,880 | $30,090 |
Source: Public Records
Map
Nearby Homes
- 109 Doe Cir
- 1229 Lakewood Dr Unit A
- 0000 Lakewood Dr
- 1180 Lakewood Dr
- 102 Raven Ct
- 1466 Mollie Dr
- 374 Edgewater Dr
- Lot 3,4,5,7,8 Edgewater Dr
- 1301 Union St
- 1455 Lake Dr
- 1739 Kingtree Dr
- 1800 Kingtree Dr
- 1605-1607 Schubert Dr
- 523 Bedford Rd
- 936 Thomas Dr
- 957 Thomas Dr
- 1539 W Us Route 6
- 1218 Gladys Ave
- 0 Anne Ln
- 1277 Fremont Ave
- 1318 Deerpath Dr
- 1316 Deerpath Dr
- 1314 Deerpath Dr
- 1312 Deerpath Dr
- 1308 Deerpath Dr
- 1306 Deerpath Dr
- 1304 Deerpath Dr
- 1309 Deerpath Dr
- 1307 Deerpath Dr
- 1305 Deerpath Dr
- 1026 W Dresden Dr
- 1028 W Dresden Dr
- 1024 W Dresden Dr
- 1034 W Dresden Dr
- 1303 Deerpath Dr
- 1312 Brendan Dr
- 1036 W Dresden Dr
- 1038 W Dresden Dr
- 1316 Brendan Dr
- 1308 Brendan Dr
Your Personal Tour Guide
Ask me questions while you tour the home.