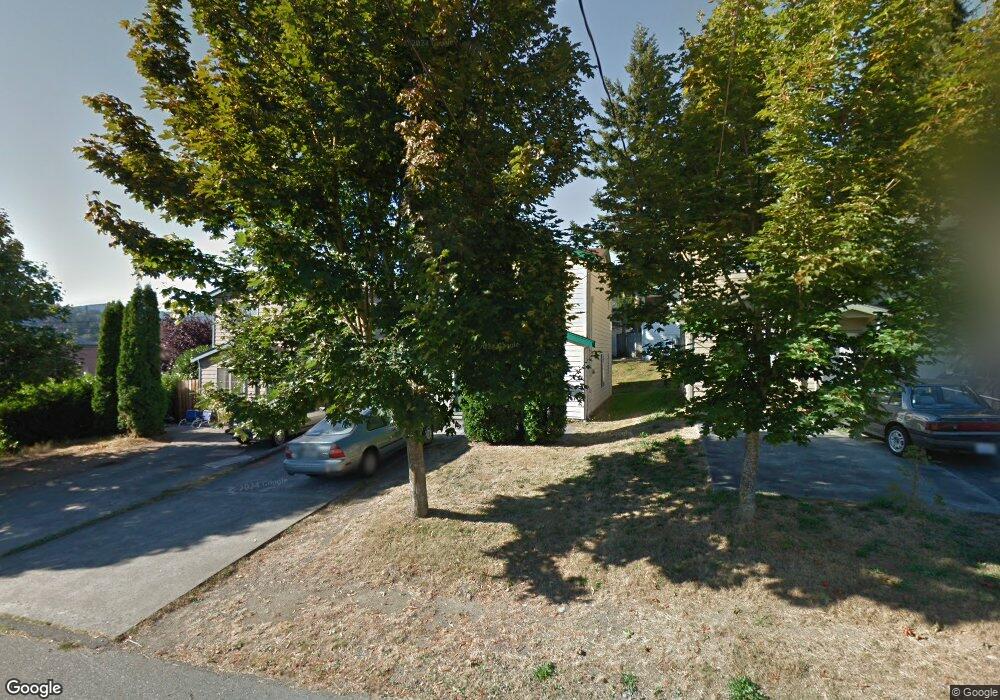
1318 E Laurel St Bellingham, WA 98225
Sehome NeighborhoodEstimated Value: $520,000 - $572,247
3
Beds
2
Baths
1,148
Sq Ft
$472/Sq Ft
Est. Value
About This Home
This home is located at 1318 E Laurel St, Bellingham, WA 98225 and is currently estimated at $541,312, approximately $471 per square foot. 1318 E Laurel St is a home located in Whatcom County with nearby schools including Happy Valley Elementary School, Fairhaven Middle School, and Sehome High School.
Ownership History
Date
Name
Owned For
Owner Type
Purchase Details
Closed on
Aug 28, 2020
Sold by
Nguyen Tracy M
Bought by
Nguyen Toai V and Ho Lang Ngoc
Current Estimated Value
Purchase Details
Closed on
Jul 25, 2011
Sold by
Allen Blake R and Allen Kristine F
Bought by
Nguyen Tracy M and Nguyen Toai
Home Financials for this Owner
Home Financials are based on the most recent Mortgage that was taken out on this home.
Original Mortgage
$149,985
Interest Rate
3.5%
Mortgage Type
FHA
Purchase Details
Closed on
Mar 11, 2002
Sold by
Phillips David and Phillips Anna Marie
Bought by
Allen Blake R and Allen Kristine F
Home Financials for this Owner
Home Financials are based on the most recent Mortgage that was taken out on this home.
Original Mortgage
$92,000
Interest Rate
6.99%
Create a Home Valuation Report for This Property
The Home Valuation Report is an in-depth analysis detailing your home's value as well as a comparison with similar homes in the area
Home Values in the Area
Average Home Value in this Area
Purchase History
| Date | Buyer | Sale Price | Title Company |
|---|---|---|---|
| Nguyen Toai V | $10,000 | None Listed On Document | |
| Nguyen Toal V | -- | None Available | |
| Nguyen Tracy M | $165,280 | Chicago Title Insurance | |
| Allen Blake R | $230,000 | Whatcom Land Title |
Source: Public Records
Mortgage History
| Date | Status | Borrower | Loan Amount |
|---|---|---|---|
| Previous Owner | Nguyen Tracy M | $149,985 | |
| Previous Owner | Allen Blake R | $92,000 |
Source: Public Records
Tax History
| Year | Tax Paid | Tax Assessment Tax Assessment Total Assessment is a certain percentage of the fair market value that is determined by local assessors to be the total taxable value of land and additions on the property. | Land | Improvement |
|---|---|---|---|---|
| 2025 | $4,229 | $532,007 | $270,336 | $261,671 |
| 2024 | $4,123 | $516,518 | $262,466 | $254,052 |
| 2023 | $4,123 | $529,669 | $269,148 | $260,521 |
| 2022 | $3,257 | $448,880 | $228,096 | $220,784 |
| 2021 | $3,196 | $350,688 | $178,200 | $172,488 |
| 2020 | $2,760 | $324,711 | $165,000 | $159,711 |
| 2019 | $2,600 | $271,045 | $136,900 | $134,145 |
| 2018 | $2,619 | $256,018 | $129,371 | $126,647 |
| 2017 | $2,280 | $220,456 | $111,185 | $109,271 |
| 2016 | $2,041 | $200,602 | $101,103 | $99,499 |
| 2015 | $2,046 | $186,960 | $95,368 | $91,592 |
| 2014 | -- | $181,338 | $92,500 | $88,838 |
| 2013 | -- | $189,429 | $97,350 | $92,079 |
Source: Public Records
Map
Nearby Homes
- 1205 E Maple St
- 125 S 34th St
- 0 Byron Ave
- 800 E Maple St
- 1205 Humboldt St
- 1200 Lincoln St Unit 404
- 1200 Lincoln St Unit 255
- 1200 Lincoln St Unit 157
- 1200 Lincoln St Unit 301
- 1200 Lincoln St Unit 231
- 1200 Lincoln St Unit 120
- 1028 Billy Frank Jr St Unit 301
- 119 Ashley Ave
- 819 High St Unit 101
- 819 High St Unit 317
- 824 Blueberry Ln
- 924 N Garden St Unit 201
- 900 N Garden St
- 826 N Garden St
- 101 43rd St
- 1312 E Laurel St
- 1320 E Laurel St
- 924 Otis St
- 1310 E Laurel St
- 1326 E Laurel St
- 3415 Abbott St
- 3448 Abbott St
- 3440 Abbott St
- 933 Otis St
- 933 -935 Otis St
- 935 Otis St
- 927 Otis St Unit 3B
- 927 Otis St Unit 3A
- 927 Otis St Unit 2B
- 927 Otis St Unit 2A
- 927 Otis St Unit 1B
- 927 Otis St Unit 1A
- 927 Otis St Unit S2
- 927 Otis St Unit S1
- 927 Otis St
Your Personal Tour Guide
Ask me questions while you tour the home.