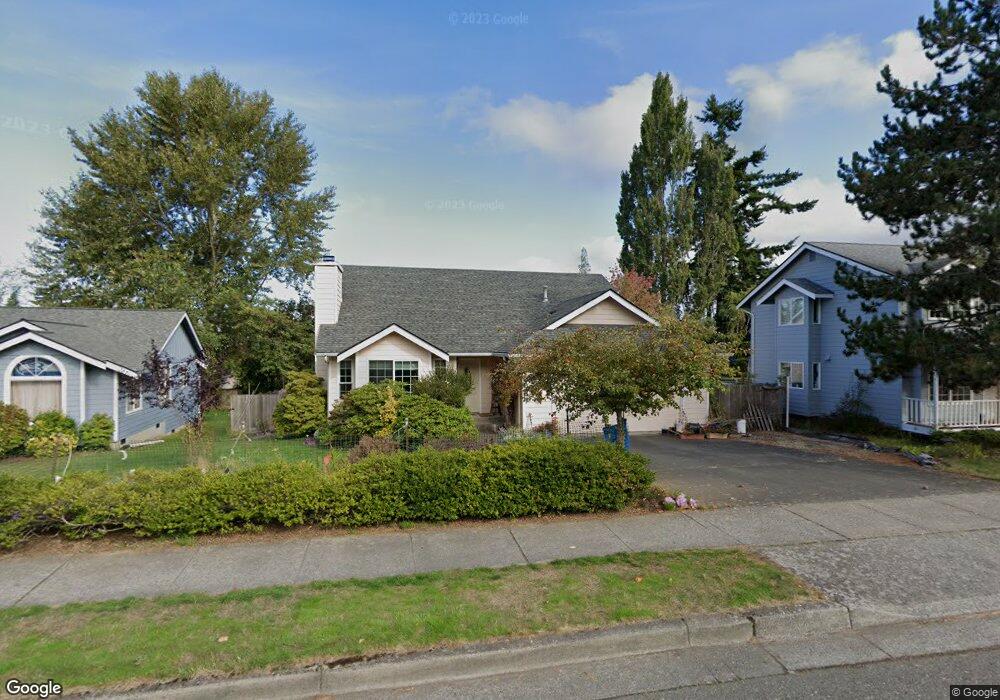
1318 Mcleod Rd Bellingham, WA 98226
Estimated Value: $555,000 - $670,959
3
Beds
3
Baths
1,078
Sq Ft
$568/Sq Ft
Est. Value
About This Home
This home is located at 1318 Mcleod Rd, Bellingham, WA 98226 and is currently estimated at $611,990, approximately $567 per square foot. 1318 Mcleod Rd is a home located in Whatcom County with nearby schools including Northern Heights Elementary School, Shuksan Middle School, and Squalicum High School.
Ownership History
Date
Name
Owned For
Owner Type
Purchase Details
Closed on
Nov 22, 2024
Sold by
Senger Clyde M and Senger Louise
Bought by
Tabatabaei Amirhossein and Mohajeri Soha Baradaran
Current Estimated Value
Home Financials for this Owner
Home Financials are based on the most recent Mortgage that was taken out on this home.
Original Mortgage
$504,000
Outstanding Balance
$499,277
Interest Rate
6.44%
Mortgage Type
New Conventional
Estimated Equity
$112,713
Purchase Details
Closed on
Sep 2, 2004
Sold by
Barclay Lori L
Bought by
Senger Clyde M and Senger Louise F
Home Financials for this Owner
Home Financials are based on the most recent Mortgage that was taken out on this home.
Original Mortgage
$196,040
Interest Rate
4.37%
Mortgage Type
Purchase Money Mortgage
Create a Home Valuation Report for This Property
The Home Valuation Report is an in-depth analysis detailing your home's value as well as a comparison with similar homes in the area
Home Values in the Area
Average Home Value in this Area
Purchase History
| Date | Buyer | Sale Price | Title Company |
|---|---|---|---|
| Tabatabaei Amirhossein | $560,000 | Chicago Title | |
| Tabatabaei Amirhossein | $560,000 | Chicago Title | |
| Senger Clyde M | $254,050 | Chicago Title Insurance |
Source: Public Records
Mortgage History
| Date | Status | Borrower | Loan Amount |
|---|---|---|---|
| Open | Tabatabaei Amirhossein | $504,000 | |
| Closed | Tabatabaei Amirhossein | $504,000 | |
| Previous Owner | Senger Clyde M | $196,040 |
Source: Public Records
Tax History Compared to Growth
Tax History
| Year | Tax Paid | Tax Assessment Tax Assessment Total Assessment is a certain percentage of the fair market value that is determined by local assessors to be the total taxable value of land and additions on the property. | Land | Improvement |
|---|---|---|---|---|
| 2024 | $5,469 | $622,172 | $242,352 | $379,820 |
| 2023 | $5,469 | $649,536 | $253,011 | $396,525 |
| 2022 | $4,336 | $528,078 | $205,700 | $322,378 |
| 2021 | $4,090 | $436,428 | $170,000 | $266,428 |
| 2020 | $3,990 | $387,100 | $132,405 | $254,695 |
| 2019 | $3,552 | $361,673 | $123,803 | $237,870 |
| 2018 | $3,683 | $324,397 | $111,053 | $213,344 |
| 2017 | $3,207 | $287,029 | $98,260 | $188,769 |
| 2016 | $2,962 | $260,857 | $89,420 | $171,437 |
| 2015 | $3,057 | $248,507 | $85,000 | $163,507 |
| 2014 | -- | $249,432 | $87,720 | $161,712 |
| 2013 | -- | $238,974 | $85,000 | $153,974 |
Source: Public Records
Map
Nearby Homes
- 1314 Welling Rd
- 1368 Roma Rd
- 1430 Welling Rd
- 1379 Northwood Ct
- 3606 Tree Farm Ct
- 3713 Bristol St
- 3709 Bristol St
- 3715 E Sunset Dr
- 3817 E Sunset Dr
- 3785 Greenville Place
- 3010 E Sunset Dr
- 3001 E Sunset Dr
- 3827 Keystone Way
- 3871 Cindy Ln
- 3527 Sussex Dr
- 0 E Bakerview Rd Unit NWM2398341
- 1580 Hillsdale Rd
- 3159 Chandler Pkwy
- 3155 Chandler Pkwy
- 3153 Chandler Pkwy
- 1318 E Mcleod Rd
- 1314 Mcleod Rd
- 1322 Mcleod Rd
- 1317 Ethan Ct
- 1321 Ethan Ct
- 1326 Mcleod Rd
- 1310 Mcleod Rd
- 1313 Ethan Ct
- 3900 Magrath Rd
- 3764 Mcgrath Rd
- 1317 Mcleod Rd
- 1325 Ethan Ct
- 1330 Mcleod Rd
- 1321 Mcleod Rd
- 1313 Mcleod Rd
- 0 W Mcleod Rd Unit 111898
- 0 W Mcleod Rd Unit 4463
- 1325 Mcleod Rd
- 3904 Magrath Rd
- 1336 Mcleod Rd