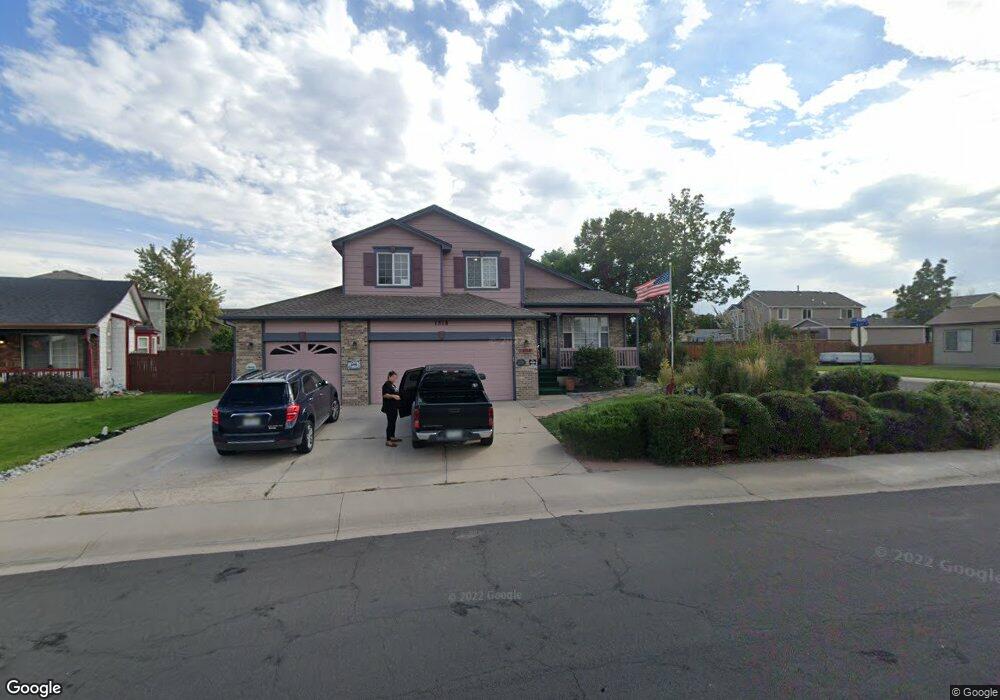
1318 Midland St Brighton, CO 80601
Estimated Value: $469,636 - $518,000
3
Beds
3
Baths
1,582
Sq Ft
$309/Sq Ft
Est. Value
About This Home
This home is located at 1318 Midland St, Brighton, CO 80601 and is currently estimated at $488,659, approximately $308 per square foot. 1318 Midland St is a home located in Adams County with nearby schools including Northeast Elementary School, Overland Trail Middle School, and Brighton High School.
Ownership History
Date
Name
Owned For
Owner Type
Purchase Details
Closed on
Apr 22, 2022
Sold by
Gallegos Jimmie and Gallegos Juanita A
Bought by
Gallegos James Joseph and Berlanga Faridha Carmen
Current Estimated Value
Home Financials for this Owner
Home Financials are based on the most recent Mortgage that was taken out on this home.
Original Mortgage
$308,700
Outstanding Balance
$290,482
Interest Rate
4.42%
Mortgage Type
Balloon
Estimated Equity
$198,177
Purchase Details
Closed on
Jan 19, 2000
Sold by
Designer Homes Llc
Bought by
Gallegos Jim and Gallegos Juanita A
Home Financials for this Owner
Home Financials are based on the most recent Mortgage that was taken out on this home.
Original Mortgage
$161,500
Interest Rate
7.95%
Purchase Details
Closed on
Aug 31, 1999
Sold by
Feather Ridge Ii Llc
Bought by
Designer Homes Llc
Create a Home Valuation Report for This Property
The Home Valuation Report is an in-depth analysis detailing your home's value as well as a comparison with similar homes in the area
Home Values in the Area
Average Home Value in this Area
Purchase History
| Date | Buyer | Sale Price | Title Company |
|---|---|---|---|
| Gallegos James Joseph | $393,000 | None Listed On Document | |
| Gallegos Jim | $170,037 | Stewart Title | |
| Designer Homes Llc | $31,900 | -- |
Source: Public Records
Mortgage History
| Date | Status | Borrower | Loan Amount |
|---|---|---|---|
| Open | Gallegos James Joseph | $308,700 | |
| Previous Owner | Gallegos Jim | $161,500 |
Source: Public Records
Tax History Compared to Growth
Tax History
| Year | Tax Paid | Tax Assessment Tax Assessment Total Assessment is a certain percentage of the fair market value that is determined by local assessors to be the total taxable value of land and additions on the property. | Land | Improvement |
|---|---|---|---|---|
| 2024 | $3,496 | $29,320 | $5,940 | $23,380 |
| 2023 | $3,476 | $35,050 | $6,430 | $28,620 |
| 2022 | $2,234 | $27,090 | $6,530 | $20,560 |
| 2021 | $2,103 | $27,090 | $6,530 | $20,560 |
| 2020 | $1,852 | $25,690 | $6,720 | $18,970 |
| 2019 | $1,856 | $25,690 | $6,720 | $18,970 |
| 2018 | $2,075 | $20,660 | $5,760 | $14,900 |
| 2017 | $2,078 | $20,660 | $5,760 | $14,900 |
| 2016 | $1,651 | $16,330 | $3,820 | $12,510 |
| 2015 | $1,640 | $16,330 | $3,820 | $12,510 |
| 2014 | $1,612 | $16,250 | $3,180 | $13,070 |
Source: Public Records
Map
Nearby Homes
- 1217 Eagle Dr
- 1608 Jennifer St
- 316 N 10th Ave
- 1726 Jennifer St
- 263 N 10th Ave
- 1734 Windler St
- 276 N 9th Ave
- 1737 Jennifer St
- 1759 Jennifer St
- 1771 Jennifer St
- 146 N 10th Ave
- 1514 Walnut Dr
- 59 N 13th Ave
- 52 N 13th Ave
- 410 N 6th Ave
- 525 Midland St
- 111 County Road 2
- 226 N 6th Ave
- 59 N 9th Ave Unit A & B
- 59 N 9th Ave Unit A and B
- 1358 Midland St
- 466 N 13th Ave
- 1296 Midland St
- 475 N 14th Ct
- 1359 Midland St
- 1319 Midland St
- 1388 Midland St
- 1293 Falcon Dr
- 1297 Midland St
- 446 N 13th Ave
- 455 N 14th Ct
- 1399 Midland St
- 1256 Midland St
- 485 N 14th Ct
- 518 N 12th Ct
- 1253 Falcon Dr
- 1428 Midland St
- 435 N 14th Ct
- 1429 Midland St
- 538 N 12th Ct