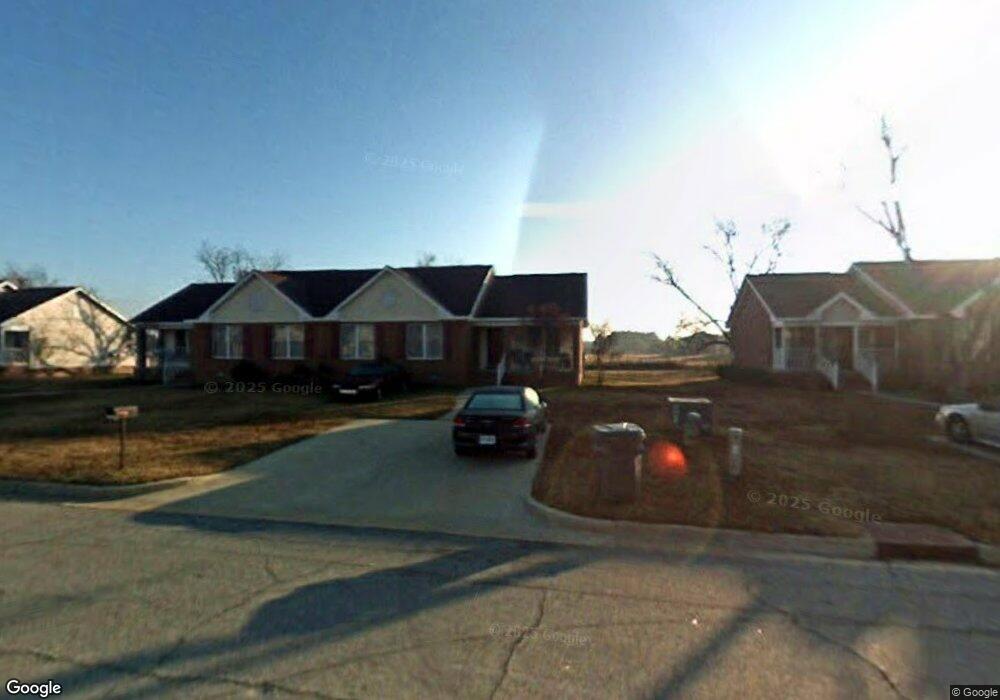
1318 Montego Ct Albany, GA 31705
Dixie Heights NeighborhoodEstimated Value: $114,000 - $137,000
3
Beds
2
Baths
1,224
Sq Ft
$103/Sq Ft
Est. Value
About This Home
This home is located at 1318 Montego Ct, Albany, GA 31705 and is currently estimated at $125,912, approximately $102 per square foot. 1318 Montego Ct is a home located in Dougherty County with nearby schools including Morningside Elementary School, Southside Middle School, and Monroe High School.
Ownership History
Date
Name
Owned For
Owner Type
Purchase Details
Closed on
Nov 6, 2024
Sold by
Mvl Properties Of Ga Llc
Bought by
Lumpkin Christopher
Current Estimated Value
Home Financials for this Owner
Home Financials are based on the most recent Mortgage that was taken out on this home.
Original Mortgage
$94,000
Outstanding Balance
$93,099
Interest Rate
6.32%
Mortgage Type
New Conventional
Estimated Equity
$32,813
Purchase Details
Closed on
Jun 29, 2021
Sold by
Malone Michelle N
Bought by
Mvl Properties Of Ga Llc
Home Financials for this Owner
Home Financials are based on the most recent Mortgage that was taken out on this home.
Original Mortgage
$74,327
Interest Rate
2.9%
Mortgage Type
Commercial
Purchase Details
Closed on
Nov 12, 2004
Sold by
City Of Albany
Bought by
Malone Michelle N
Purchase Details
Closed on
Jan 24, 1994
Sold by
Wright William B
Bought by
City Of Albany
Create a Home Valuation Report for This Property
The Home Valuation Report is an in-depth analysis detailing your home's value as well as a comparison with similar homes in the area
Home Values in the Area
Average Home Value in this Area
Purchase History
| Date | Buyer | Sale Price | Title Company |
|---|---|---|---|
| Lumpkin Christopher | $126,000 | -- | |
| Mvl Properties Of Ga Llc | $110,000 | -- | |
| Malone Michelle N | $45,000 | -- | |
| City Of Albany | -- | -- |
Source: Public Records
Mortgage History
| Date | Status | Borrower | Loan Amount |
|---|---|---|---|
| Open | Lumpkin Christopher | $94,000 | |
| Previous Owner | Mvl Properties Of Ga Llc | $74,327 |
Source: Public Records
Tax History Compared to Growth
Tax History
| Year | Tax Paid | Tax Assessment Tax Assessment Total Assessment is a certain percentage of the fair market value that is determined by local assessors to be the total taxable value of land and additions on the property. | Land | Improvement |
|---|---|---|---|---|
| 2024 | $1,716 | $35,960 | $4,600 | $31,360 |
| 2023 | $1,675 | $35,960 | $4,600 | $31,360 |
| 2022 | $1,682 | $35,960 | $4,600 | $31,360 |
| 2021 | $1,472 | $35,960 | $4,600 | $31,360 |
| 2020 | $1,476 | $35,960 | $4,600 | $31,360 |
| 2019 | $1,481 | $35,960 | $4,600 | $31,360 |
| 2018 | $1,488 | $35,960 | $4,600 | $31,360 |
| 2017 | $1,386 | $35,960 | $4,600 | $31,360 |
| 2016 | $1,387 | $35,960 | $4,600 | $31,360 |
| 2015 | $1,390 | $35,960 | $4,600 | $31,360 |
| 2014 | $1,373 | $35,960 | $4,600 | $31,360 |
Source: Public Records
Map
Nearby Homes
- 1304 Mobile Ave
- 104 Daniel Ct
- 111 Morningside Dr
- 109 Morningside Dr
- 1011 Crawford Dr
- 939 Crawford Dr
- 410 Rosser Ln
- 502 Mitchell Ave
- 916 Crawford Dr
- 925 Mercedes St
- 911 Mercedes St
- 811 S Maple St
- 1401 E Waddell Ave
- 608 Cason St
- 1411 E Gordon Ave
- 1400 E Lincoln Ave
- 1408 E Mercer Ave
- 211 Collins St
- 205 Collins St
- 210 S Carroll St
- 1320 Montego Ct
- 1316 Montego Ct
- 1314 Montego Ct
- 1322 Montego Ct
- 1324 Montego Ct
- 1312 Montego Ct
- 1319 Montego Ct
- 1321 Montego Ct
- 1317 Montego Ct
- 1326 Montego Ct
- 1323 Montego Ct
- 1310 Montego Ct
- 1315 Montego Ct
- 1325 Montego Ct
- 1328 Montego Ct
- 1313 Montego Ct
- 1308 Montego Ct
- 1327 Montego Ct
- 1330 Montego Ct
- 1311 Montego Ct