
Seller's Agent in 2026
Benjamin Hemmert
Howard Hanna Real Estate Svcs
(614) 309-6197
1 in this area
211 Total Sales
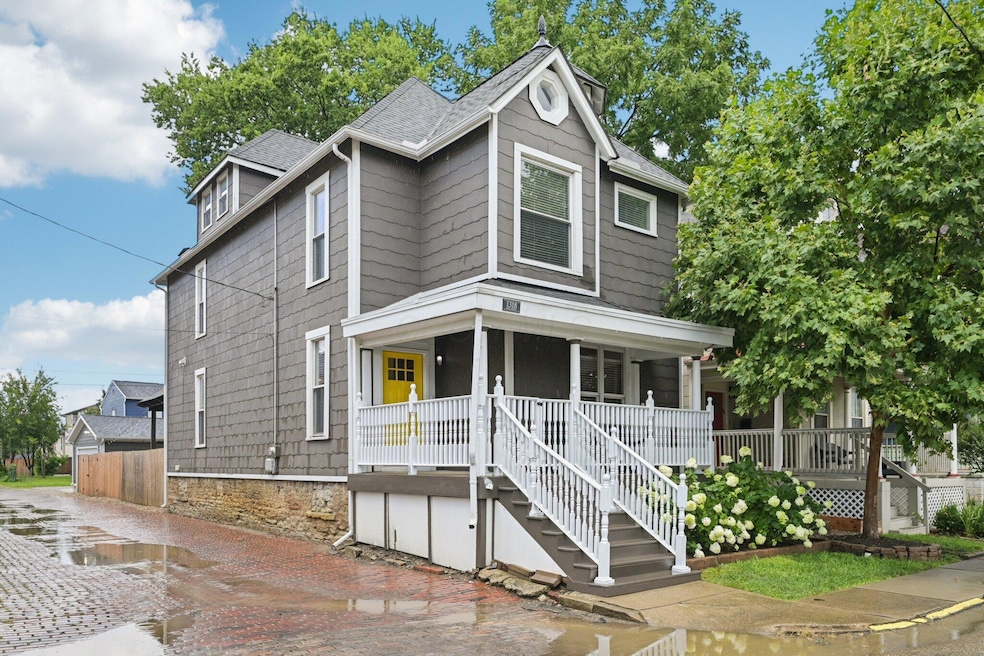


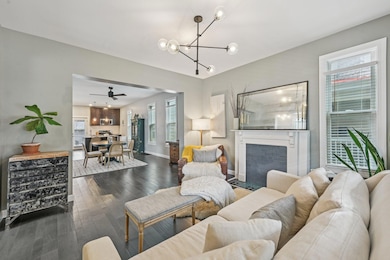
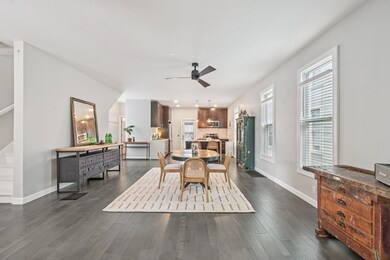

Discover timeless charm and modern living in this beautifully maintained 4-bedroom, 3 bath approx. 2,202 sq ft home located at 1318 Oak Street in the heart of historic Olde Towne East. Sitting on a spacious corner lot, this turn-of-the-century residence offers a rare combination of classic architecture and thoughtful updates in one of Columbus's most vibrant neighborhoods. Step inside to find hardwood floors, tall ceilings, and abundant natural light streaming through large windows. The main floor features spacious living and dining areas, ideal for entertaining or relaxing at home. The updated kitchen provides both style and functionality, while the second floor hosts three large bedrooms and 2 updated full baths. And on the third level find a huge space, complete with skylights, to make a lovely 4th bedroom, flex space or the perfect space to serve your work-from-home needs. Outside, enjoy a welcoming front porch, a private fenced backyard, a covered patio area, and a newly built detached 2-car garage as well as off street spot which is an increasingly rare amenity in this area. Whether you're hosting gatherings or enjoying a quiet evening, the outdoor space offers versatility and comfort. Located close to Franklin Park, the Trolley District, East Market, and Downtown Columbus, you'll have quick access to top restaurants, breweries, parks, and more. Don't miss your chance to own a piece of Columbus history with modern comfort and unbeatable location!
Last Agent to Sell the Property
Howard Hanna Real Estate Svcs License #2002020344 Listed on: 08/01/2025
| Date | Type | Sale Price | Title Company |
|---|---|---|---|
| Warranty Deed | $499,000 | Crown Search Box | |
| Warranty Deed | $305,000 | None Available | |
| Quit Claim Deed | -- | None Available | |
| Executors Deed | $46,500 | Peak Title | |
| Interfamily Deed Transfer | -- | Attorney | |
| Deed | $7,000 | -- | |
| Deed | $24,200 | -- | |
| Deed | -- | -- |
| Date | Status | Loan Amount | Loan Type |
|---|---|---|---|
| Open | $449,100 | Credit Line Revolving | |
| Previous Owner | $274,500 | New Conventional |
| Date | Event | Price | List to Sale | Price per Sq Ft |
|---|---|---|---|---|
| 02/09/2026 02/09/26 | Sold | $499,000 | 0.0% | $227 / Sq Ft |
| 10/06/2025 10/06/25 | Price Changed | $499,000 | -2.2% | $227 / Sq Ft |
| 09/13/2025 09/13/25 | Price Changed | $510,000 | -1.9% | $232 / Sq Ft |
| 08/11/2025 08/11/25 | Price Changed | $520,000 | -2.8% | $236 / Sq Ft |
| 08/01/2025 08/01/25 | For Sale | $535,000 | -- | $243 / Sq Ft |
| Year | Tax Paid | Tax Assessment Tax Assessment Total Assessment is a certain percentage of the fair market value that is determined by local assessors to be the total taxable value of land and additions on the property. | Land | Improvement |
|---|---|---|---|---|
| 2025 | $5,843 | $130,200 | $31,710 | $98,490 |
| 2024 | $5,843 | $130,200 | $31,710 | $98,490 |
| 2023 | $5,769 | $130,200 | $31,710 | $98,490 |
| 2022 | $4,985 | $96,110 | $5,180 | $90,930 |
| 2021 | $4,994 | $96,110 | $5,180 | $90,930 |
| 2020 | $5,000 | $96,110 | $5,180 | $90,930 |
| 2019 | $4,494 | $72,280 | $3,570 | $68,710 |
| 2018 | $1,309 | $16,280 | $3,570 | $12,710 |
| 2017 | $1,543 | $31,050 | $3,570 | $27,480 |
| 2016 | $1,106 | $16,280 | $3,470 | $12,810 |
| 2015 | $1,457 | $23,560 | $3,470 | $20,090 |
| 2014 | $1,461 | $23,560 | $3,470 | $20,090 |
| 2013 | $655 | $21,420 | $3,150 | $18,270 |
Seller's Agent in 2026
Benjamin Hemmert
Howard Hanna Real Estate Svcs
(614) 309-6197
1 in this area
211 Total Sales
Buyer's Agent in 2026
Priscilla Johnson
KW Classic Properties Realty
(614) 638-5817
4 in this area
74 Total Sales
Source: Columbus and Central Ohio Regional MLS
MLS Number: 225028800
APN: 010-030250
Disclaimer: Certain information contained herein is derived from information provided by parties other than Homes.com. All information provided is deemed reliable, but is not guaranteed to be accurate and should be independently verified.
![]() IDX information is provided exclusively for personal, non-commercial use, and may not be used for any purpose other than to identify prospective properties consumers may be interested in purchasing.
IDX information is provided exclusively for personal, non-commercial use, and may not be used for any purpose other than to identify prospective properties consumers may be interested in purchasing.
Information is deemed reliable but not guaranteed.
Ask me questions while you tour the home.