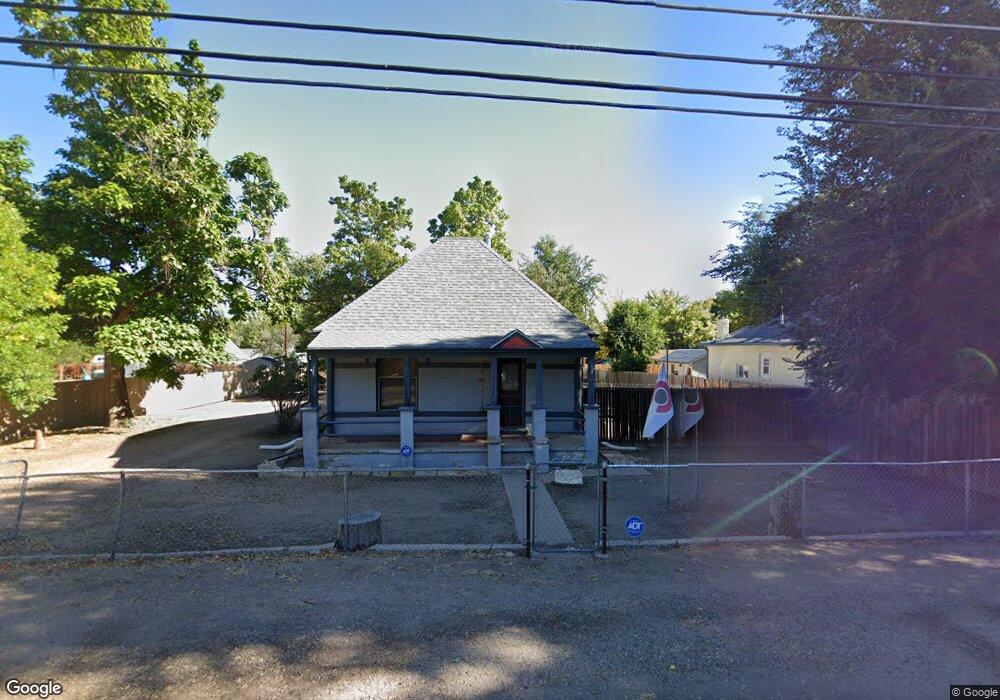
1318 W 3rd St Florence, CO 81226
Estimated Value: $167,000 - $226,000
2
Beds
1
Bath
1,016
Sq Ft
$187/Sq Ft
Est. Value
About This Home
This home is located at 1318 W 3rd St, Florence, CO 81226 and is currently estimated at $189,900, approximately $186 per square foot. 1318 W 3rd St is a home located in Fremont County with nearby schools including Fremont Elementary School, Florence High School, and Florence Christian School.
Ownership History
Date
Name
Owned For
Owner Type
Purchase Details
Closed on
Dec 27, 2016
Sold by
Wells Fargo Bank National Association
Bought by
Sweeney Kevin T and Sweeney Karen S
Current Estimated Value
Purchase Details
Closed on
Sep 27, 2016
Sold by
Pacheco Heather L
Bought by
Wells Fargo Bank Na
Purchase Details
Closed on
Mar 21, 2006
Sold by
Montez Fernando L
Bought by
Pacheco Heather L
Home Financials for this Owner
Home Financials are based on the most recent Mortgage that was taken out on this home.
Original Mortgage
$74,500
Interest Rate
9%
Mortgage Type
Adjustable Rate Mortgage/ARM
Purchase Details
Closed on
Aug 13, 2002
Sold by
Harvey
Bought by
Montez
Purchase Details
Closed on
Aug 22, 1997
Sold by
Abila
Bought by
Harvey
Create a Home Valuation Report for This Property
The Home Valuation Report is an in-depth analysis detailing your home's value as well as a comparison with similar homes in the area
Home Values in the Area
Average Home Value in this Area
Purchase History
| Date | Buyer | Sale Price | Title Company |
|---|---|---|---|
| Sweeney Kevin T | $55,684 | Premium Title Services Inc | |
| Wells Fargo Bank Na | -- | None Available | |
| Pacheco Heather L | $78,500 | None Available | |
| Montez | $45,000 | -- | |
| Harvey | $46,000 | -- |
Source: Public Records
Mortgage History
| Date | Status | Borrower | Loan Amount |
|---|---|---|---|
| Previous Owner | Pacheco Heather L | $74,500 |
Source: Public Records
Tax History Compared to Growth
Tax History
| Year | Tax Paid | Tax Assessment Tax Assessment Total Assessment is a certain percentage of the fair market value that is determined by local assessors to be the total taxable value of land and additions on the property. | Land | Improvement |
|---|---|---|---|---|
| 2024 | $443 | $10,814 | $0 | $0 |
| 2023 | $443 | $7,129 | $0 | $0 |
| 2022 | $491 | $7,988 | $0 | $0 |
| 2021 | $496 | $8,218 | $0 | $0 |
| 2020 | $284 | $5,685 | $0 | $0 |
| 2019 | $287 | $5,685 | $0 | $0 |
| 2018 | $227 | $4,550 | $0 | $0 |
| 2017 | $233 | $4,550 | $0 | $0 |
| 2016 | $188 | $3,710 | $0 | $0 |
| 2015 | $185 | $3,710 | $0 | $0 |
| 2012 | -- | $4,422 | $1,409 | $3,013 |
Source: Public Records
Map
Nearby Homes
- 350 Oak St
- 1016 W 2nd St
- 560 Oak Creek Ave
- 1001 W 1st St
- 808 W 5th St
- 911 W 1st St
- 901 W 1st St
- 212 Mica St
- 212 High Meadows Ct
- 510 W 2nd St
- 529 W Main St
- 521 W Main St
- 303 W 7th St
- 303 W 7th St Unit 2
- 511 W Main St
- 207 High Meadows Dr
- 184 High Meadows Dr
- 178 High Meadows Dr
- 163 High Meadows Dr
- 161 High Meadows Dr