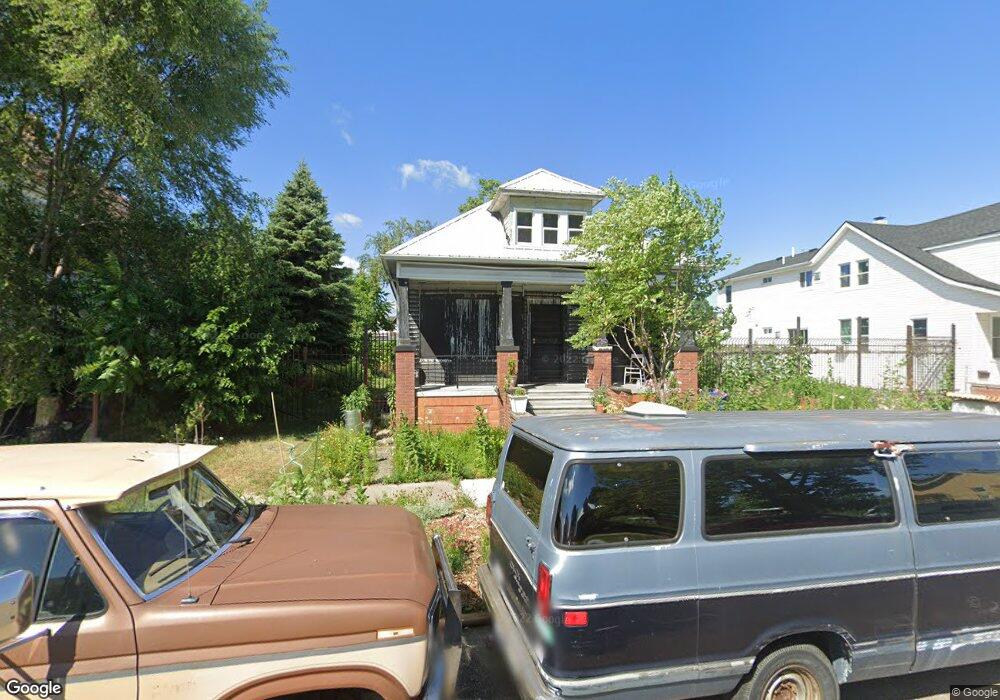
13181 Moran St HamtraMcK, MI 48212
Campau-Banglatown NeighborhoodEstimated Value: $124,538 - $211,000
Studio
1
Bath
1,200
Sq Ft
$146/Sq Ft
Est. Value
About This Home
This home is located at 13181 Moran St, HamtraMcK, MI 48212 and is currently estimated at $174,635, approximately $145 per square foot. 13181 Moran St is a home located in Wayne County with nearby schools including Davison Elementary-Middle School, Charles L. Spain Elementary-Middle School, and Edward 'Duke' Ellington Conservatory of Music and Art.
Ownership History
Date
Name
Owned For
Owner Type
Purchase Details
Closed on
Dec 19, 2023
Sold by
Power House Productions
Bought by
Society For The Promotion Of Art And Recreati
Current Estimated Value
Purchase Details
Closed on
Nov 29, 2010
Sold by
Wojtowicz Raymond J
Bought by
Power House Productions
Purchase Details
Closed on
Aug 5, 2005
Sold by
Turner Walter and Turner Yolanda
Bought by
Roquemore Shawn
Home Financials for this Owner
Home Financials are based on the most recent Mortgage that was taken out on this home.
Original Mortgage
$71,250
Interest Rate
7.55%
Mortgage Type
Fannie Mae Freddie Mac
Purchase Details
Closed on
Aug 19, 2004
Sold by
Detroit Neighborhood Development Corp
Bought by
Turner Walter
Purchase Details
Closed on
Oct 28, 2003
Sold by
Detroit Neighborhood Development Corp
Bought by
Turner Walter
Create a Home Valuation Report for This Property
The Home Valuation Report is an in-depth analysis detailing your home's value as well as a comparison with similar homes in the area
Home Values in the Area
Average Home Value in this Area
Purchase History
| Date | Buyer | Sale Price | Title Company |
|---|---|---|---|
| Society For The Promotion Of Art And Recreati | -- | None Listed On Document | |
| Power House Productions | $500 | None Available | |
| Roquemore Shawn | $75,000 | Able Title Agency Llc | |
| Turner Walter | -- | -- | |
| Turner Walter | -- | Lamont Title Corporation |
Source: Public Records
Mortgage History
| Date | Status | Borrower | Loan Amount |
|---|---|---|---|
| Previous Owner | Roquemore Shawn | $71,250 |
Source: Public Records
Tax History
| Year | Tax Paid | Tax Assessment Tax Assessment Total Assessment is a certain percentage of the fair market value that is determined by local assessors to be the total taxable value of land and additions on the property. | Land | Improvement |
|---|---|---|---|---|
| 2025 | $1,809 | $23,900 | $0 | $0 |
| 2024 | $1,787 | $20,400 | $0 | $0 |
| 2023 | $862 | $14,000 | $0 | $0 |
| 2022 | $913 | $13,800 | $0 | $0 |
| 2021 | $890 | $10,900 | $0 | $0 |
| 2020 | $890 | $9,900 | $0 | $0 |
| 2019 | $878 | $8,100 | $0 | $0 |
| 2018 | $782 | $7,100 | $0 | $0 |
| 2017 | $131 | $6,900 | $0 | $0 |
| 2016 | $1,182 | $17,700 | $0 | $0 |
| 2015 | $70 | $700 | $0 | $0 |
| 2013 | $1,487 | $14,872 | $0 | $0 |
| 2010 | -- | $22,354 | $708 | $21,646 |
Source: Public Records
Map
Nearby Homes
- 12621 Moran St
- 12660 Gallagher St
- 3346 Meade St
- 13402 Dean St
- 13486 Gallagher St
- 12511 Gallagher St
- 13826 Gallagher St
- 12309 Klinger St
- 13401 Justine St
- 3875 Sobieski St
- 4994 Carpenter Ave
- 12099 Klinger St
- 17144 Justine St
- 12091 Sobieski St
- 12140 Mitchell St
- 17138 Eureka St
- 4590 Charles St
- 13479 Mackay St
- 13500 Fenelon St
- 3935 Caely St
- 13191 Moran St
- 13167 Moran St
- 13155 Moran St
- 13208 Klinger St
- 13197 Moran St
- 13200 Klinger St
- 13212 Klinger St
- 13216 Klinger St
- 13166 Klinger St
- 13149 Moran St
- 13222 Klinger St
- 13160 Klinger St
- 13209 Moran St
- 13178 Moran St
- 13172 Moran St
- 13184 Moran St
- 13230 Klinger St
- 13154 Klinger St
- 13190 Moran St
- 13166 Moran St
Your Personal Tour Guide
Ask me questions while you tour the home.