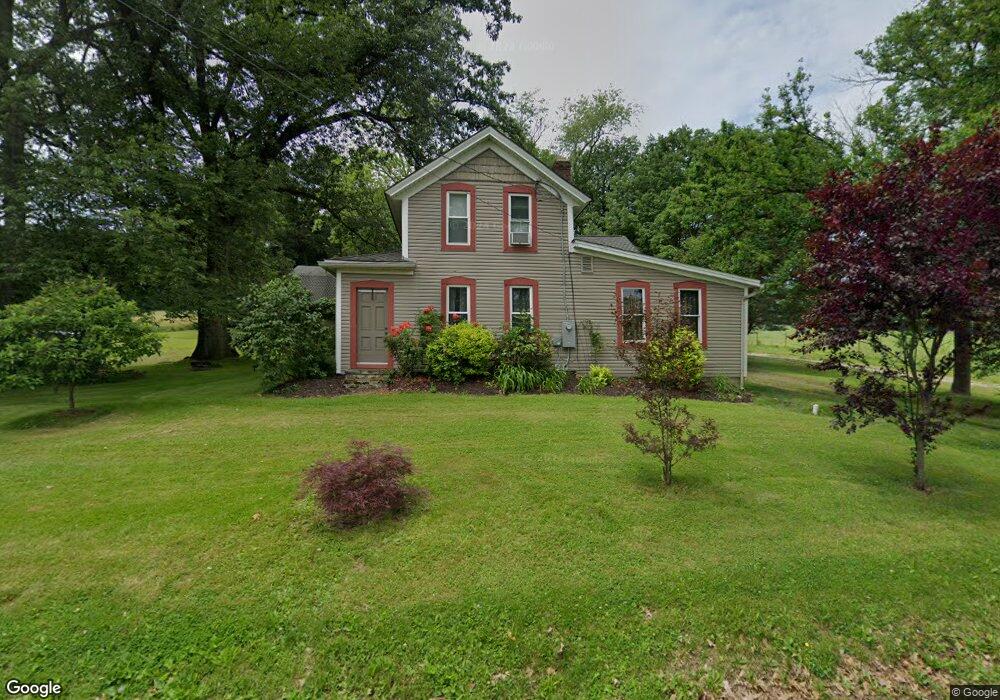
13188 Calaboone Rd Doylestown, OH 44230
Estimated Value: $335,000 - $379,000
3
Beds
2
Baths
2,230
Sq Ft
$159/Sq Ft
Est. Value
About This Home
This home is located at 13188 Calaboone Rd, Doylestown, OH 44230 and is currently estimated at $354,609, approximately $159 per square foot. 13188 Calaboone Rd is a home located in Wayne County with nearby schools including Hazel Harvey Elementary School, Chippewa Intermediate School, and Chippewa Jr./Sr. High School.
Ownership History
Date
Name
Owned For
Owner Type
Purchase Details
Closed on
Jan 9, 2002
Sold by
Gascon John A
Bought by
Sovak Brian C and Sovak Kathleen A
Current Estimated Value
Home Financials for this Owner
Home Financials are based on the most recent Mortgage that was taken out on this home.
Original Mortgage
$124,400
Outstanding Balance
$50,944
Interest Rate
7.07%
Mortgage Type
New Conventional
Estimated Equity
$303,665
Purchase Details
Closed on
May 3, 1996
Sold by
Foster Russell G
Bought by
Gascon John A and Gascon Kelli S
Home Financials for this Owner
Home Financials are based on the most recent Mortgage that was taken out on this home.
Original Mortgage
$94,400
Interest Rate
6.38%
Mortgage Type
New Conventional
Purchase Details
Closed on
Apr 10, 1989
Sold by
Foster Charles W and Foster Edith
Bought by
Foster Russell G and Foster Sharon
Create a Home Valuation Report for This Property
The Home Valuation Report is an in-depth analysis detailing your home's value as well as a comparison with similar homes in the area
Home Values in the Area
Average Home Value in this Area
Purchase History
| Date | Buyer | Sale Price | Title Company |
|---|---|---|---|
| Sovak Brian C | $131,000 | -- | |
| Gascon John A | $118,000 | -- | |
| Foster Russell G | $55,000 | -- |
Source: Public Records
Mortgage History
| Date | Status | Borrower | Loan Amount |
|---|---|---|---|
| Open | Sovak Brian C | $124,400 | |
| Previous Owner | Gascon John A | $94,400 |
Source: Public Records
Tax History Compared to Growth
Tax History
| Year | Tax Paid | Tax Assessment Tax Assessment Total Assessment is a certain percentage of the fair market value that is determined by local assessors to be the total taxable value of land and additions on the property. | Land | Improvement |
|---|---|---|---|---|
| 2024 | $3,522 | $101,320 | $19,060 | $82,260 |
| 2023 | $3,522 | $101,320 | $19,060 | $82,260 |
| 2022 | $2,628 | $69,400 | $13,060 | $56,340 |
| 2021 | $2,640 | $69,400 | $13,060 | $56,340 |
| 2020 | $2,658 | $69,400 | $13,060 | $56,340 |
| 2019 | $2,157 | $54,290 | $12,270 | $42,020 |
| 2018 | $2,178 | $54,290 | $12,270 | $42,020 |
| 2017 | $2,128 | $54,290 | $12,270 | $42,020 |
| 2016 | $2,106 | $52,200 | $11,800 | $40,400 |
| 2015 | $2,096 | $52,200 | $11,800 | $40,400 |
| 2014 | $1,841 | $52,200 | $11,800 | $40,400 |
| 2013 | $1,776 | $48,840 | $11,170 | $37,670 |
Source: Public Records
Map
Nearby Homes
- 100 Merlot Ct
- 605 Vineyard Way
- 325 Catawba Path
- 12214 Vince Dr
- 154 Circle Dr
- 46 Hidden Pond Dr
- 580 Thorn Way
- 680 Thorn Way
- 620 Thorn Way
- 14328 Calaboone Rd
- 270 Maple St
- 517 N Portage St
- 18592 Edwards Rd Unit 156
- 436 N Portage St
- 18100 Grill Rd
- 0 S Portage St
- VL 1067 Homan Dr
- 11626 Black Diamond Rd
- 340 Gates St
- 77 Koehler Ave
- 17213 Edwards Rd
- 17213 Edwards Rd
- 13110 Calaboone Rd
- 17253 Edwards Rd
- 13077 Calaboone Rd
- 13056 Calaboone Rd
- 13386 Calaboone Rd
- 17357 Edwards Rd
- 0 Calaboone Rd Unit 4022241
- 0 Calaboone Rd Unit 3987351
- 0 Calaboone Rd Unit 3924469
- 17391 Edwards Rd
- 17447 Edwards Rd
- 90 Calaboone Rd
- 17395 Edwards Rd
- 17476 Edwards Rd
- 112 Calaboone Rd
- 122 Calaboone Rd
- 106 Calaboone Rd
- 165 Merlot Ct