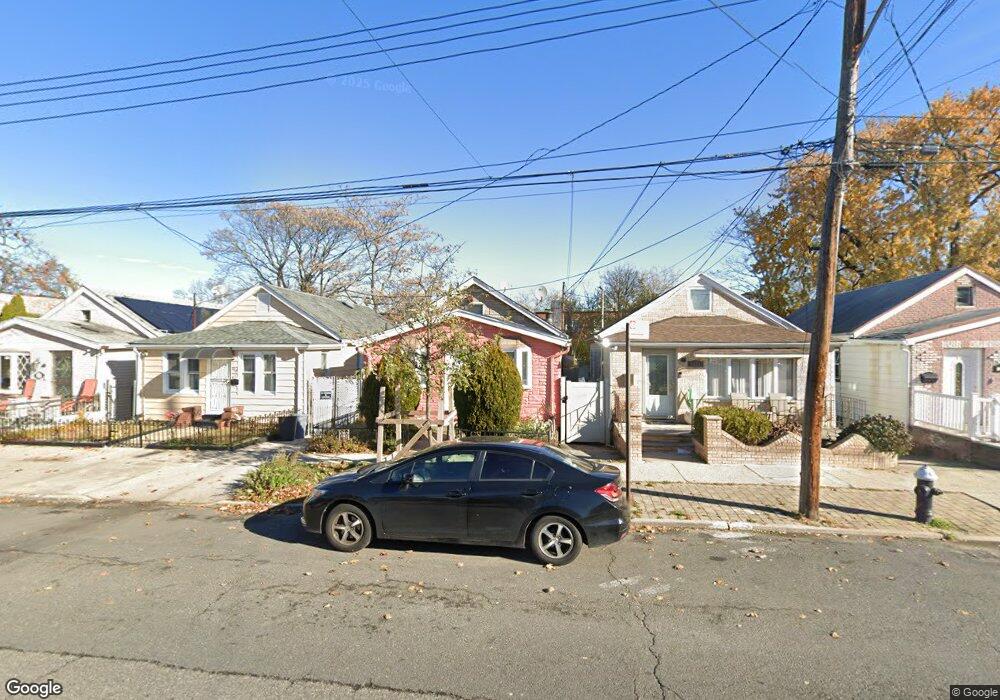
1319 E 98th St Brooklyn, NY 11236
Canarsie NeighborhoodEstimated Value: $491,000 - $677,000
Studio
--
Bath
744
Sq Ft
$798/Sq Ft
Est. Value
About This Home
This home is located at 1319 E 98th St, Brooklyn, NY 11236 and is currently estimated at $593,408, approximately $797 per square foot. 1319 E 98th St is a home located in Kings County with nearby schools including P.S. 279 Herman Schreiber, I.S. 211 John Wilson, and Canarsie Ascend Charter School.
Ownership History
Date
Name
Owned For
Owner Type
Purchase Details
Closed on
Oct 8, 2009
Sold by
Mcculloch Hyacinth
Bought by
S & Emanagement Llc
Current Estimated Value
Purchase Details
Closed on
May 7, 2007
Sold by
Haynes Bevita
Bought by
Mcculloch Hyacinth
Home Financials for this Owner
Home Financials are based on the most recent Mortgage that was taken out on this home.
Original Mortgage
$350,000
Interest Rate
6.18%
Mortgage Type
Purchase Money Mortgage
Purchase Details
Closed on
May 31, 2000
Sold by
Port Realty Group Llc
Bought by
Edwards Larry L and Ginn Delores R
Home Financials for this Owner
Home Financials are based on the most recent Mortgage that was taken out on this home.
Original Mortgage
$188,400
Interest Rate
8.18%
Mortgage Type
FHA
Purchase Details
Closed on
Aug 26, 1999
Sold by
Napoli Robert
Bought by
Bankers Trust Company Of California Na
Create a Home Valuation Report for This Property
The Home Valuation Report is an in-depth analysis detailing your home's value as well as a comparison with similar homes in the area
Home Values in the Area
Average Home Value in this Area
Purchase History
| Date | Buyer | Sale Price | Title Company |
|---|---|---|---|
| S & Emanagement Llc | -- | -- | |
| S & Emanagement Llc | -- | -- | |
| Mcculloch Hyacinth | $350,000 | -- | |
| Mcculloch Hyacinth | $350,000 | -- | |
| Edwards Larry L | $190,000 | Titleguard Inc | |
| Edwards Larry L | $190,000 | Titleguard Inc | |
| Bankers Trust Company Of California Na | $173,000 | Li Title Agency | |
| Bankers Trust Company Of California Na | $173,000 | Li Title Agency |
Source: Public Records
Mortgage History
| Date | Status | Borrower | Loan Amount |
|---|---|---|---|
| Previous Owner | Mcculloch Hyacinth | $350,000 | |
| Previous Owner | Edwards Larry L | $188,400 |
Source: Public Records
Tax History
| Year | Tax Paid | Tax Assessment Tax Assessment Total Assessment is a certain percentage of the fair market value that is determined by local assessors to be the total taxable value of land and additions on the property. | Land | Improvement |
|---|---|---|---|---|
| 2025 | $4,095 | $37,860 | $9,240 | $28,620 |
| 2024 | $4,095 | $40,620 | $9,240 | $31,380 |
| 2023 | $4,110 | $43,920 | $9,240 | $34,680 |
| 2022 | $3,811 | $36,900 | $9,240 | $27,660 |
| 2021 | $3,790 | $28,500 | $9,240 | $19,260 |
| 2020 | $3,576 | $24,780 | $9,240 | $15,540 |
| 2019 | $3,555 | $24,780 | $9,240 | $15,540 |
| 2018 | $3,438 | $16,863 | $6,943 | $9,920 |
| 2017 | $3,243 | $15,909 | $7,515 | $8,394 |
| 2016 | $3,000 | $15,009 | $7,246 | $7,763 |
| 2015 | $2,284 | $14,160 | $7,680 | $6,480 |
| 2014 | $2,284 | $14,160 | $7,680 | $6,480 |
Source: Public Records
Map
Nearby Homes
- 1130 E 99th St
- 1154 E 100th St
- 1707 Rockaway Pkwy
- 1769 Rockaway Pkwy
- 1124 E 100th St
- 9722 Avenue K
- 10009 Avenue L
- 1791 Rockaway Pkwy
- 1154 E 101st St
- 1361 E 96th St
- 10016 Avenue L
- 1242 E 100th St
- 1118 E 101st St
- 1161 E 101st St
- 1131 E 101st St
- 1258 E 98th St
- 1450 E 98th St
- 1250 E 98th St
- 1054 E 100th St
- 1241 E 98th St
- 1317 E 98th St
- 1315 E 98th St
- 1321 E 98th St
- 1309 E 98th St
- 1323 E 98th St
- 1323 E 98 St
- 1307 E 98th St
- 1307 E 98th St Unit 1
- 1134 E 99th St
- 1132 E 99th St
- 1325 E 98th St
- 1136 E 99th St
- 1138 E 99th St
- 1305 E 98th St
- 1140 E 99th St
- 1126 E 99th St
- 1327 E 98th St
- 1142 E 99th St
- 1301 E 98th St
- 1124 E 99th St
Your Personal Tour Guide
Ask me questions while you tour the home.