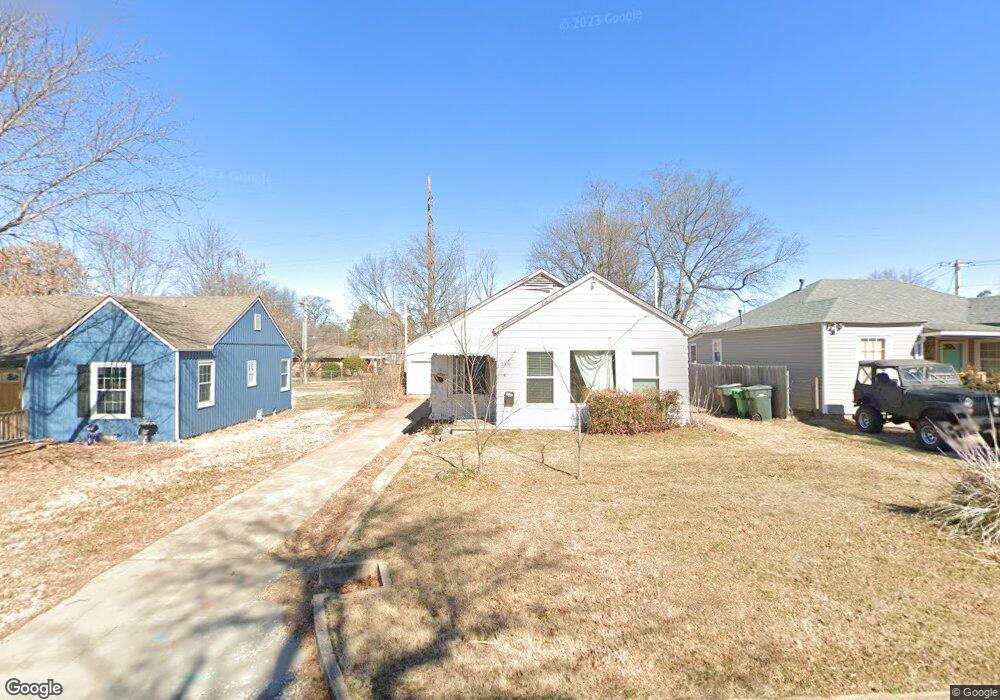
1319 E Jackson Ave N Sapulpa, OK 74066
Estimated Value: $132,000 - $175,261
3
Beds
1
Bath
1,168
Sq Ft
$132/Sq Ft
Est. Value
About This Home
This home is located at 1319 E Jackson Ave N, Sapulpa, OK 74066 and is currently estimated at $154,315, approximately $132 per square foot. 1319 E Jackson Ave N is a home located in Creek County with nearby schools including Sapulpa Junior High School, Sapulpa Middle School, and Sapulpa High School.
Ownership History
Date
Name
Owned For
Owner Type
Purchase Details
Closed on
Feb 9, 2023
Sold by
Sy Enterprises Llc
Bought by
Hendrix Ashlynn and Hendrix Christopher
Current Estimated Value
Home Financials for this Owner
Home Financials are based on the most recent Mortgage that was taken out on this home.
Original Mortgage
$5,292
Outstanding Balance
$5,120
Interest Rate
6.32%
Estimated Equity
$149,195
Purchase Details
Closed on
Apr 22, 2022
Sold by
Gosvener Clarence G and Gosvener Jean Deborah
Bought by
Sy Enterprises Llc
Home Financials for this Owner
Home Financials are based on the most recent Mortgage that was taken out on this home.
Original Mortgage
$101,250
Interest Rate
5.1%
Mortgage Type
New Conventional
Create a Home Valuation Report for This Property
The Home Valuation Report is an in-depth analysis detailing your home's value as well as a comparison with similar homes in the area
Home Values in the Area
Average Home Value in this Area
Purchase History
| Date | Buyer | Sale Price | Title Company |
|---|---|---|---|
| Hendrix Ashlynn | $154,000 | Integrity Title & Closing | |
| Sy Enterprises Llc | $70,500 | Apex Title & Closing Services |
Source: Public Records
Mortgage History
| Date | Status | Borrower | Loan Amount |
|---|---|---|---|
| Open | Hendrix Ashlynn | $5,292 | |
| Open | Hendrix Ashlynn | $151,210 | |
| Previous Owner | Sy Enterprises Llc | $101,250 |
Source: Public Records
Tax History
| Year | Tax Paid | Tax Assessment Tax Assessment Total Assessment is a certain percentage of the fair market value that is determined by local assessors to be the total taxable value of land and additions on the property. | Land | Improvement |
|---|---|---|---|---|
| 2025 | $2,358 | $19,404 | $2,962 | $16,442 |
| 2024 | $2,247 | $18,480 | $2,029 | $16,451 |
| 2023 | $2,247 | $14,583 | $1,440 | $13,143 |
| 2022 | $459 | $4,000 | $1,440 | $2,560 |
| 2021 | $452 | $3,809 | $1,440 | $2,369 |
| 2020 | $464 | $3,932 | $1,426 | $2,506 |
| 2019 | $444 | $3,746 | $1,391 | $2,355 |
| 2018 | $432 | $3,567 | $1,344 | $2,223 |
| 2017 | $429 | $3,567 | $1,344 | $2,223 |
| 2016 | $408 | $3,567 | $1,344 | $2,223 |
| 2015 | -- | $3,567 | $1,344 | $2,223 |
| 2014 | -- | $3,567 | $1,344 | $2,223 |
Source: Public Records
Map
Nearby Homes
- 103 Woodview Ln
- 1509 E Jones Ave
- 209 N Leahy St
- 0 E Dewey Ave
- 1137 E Perkins Ave
- 1506 University Cir
- 1002 E Line Ave
- 443 Shadow Ln
- 1033 E Thompson Ave
- 784 N Moccasin Place
- 1501 E Fairview Ave
- 1128 E Arch Ave
- 642 E Line Ave
- 640 E Line Ave
- 319 S Division St
- 1532 Melissa Cir
- 1201 E Cleveland Ave
- 204 S Birch St
- 207 S Walnut St
- 1607 Kingsway St
- 1317 E Jackson Ave N
- 1321 E Jackson Ave N
- 1743 E Jackson Ave N
- 1315 Jackson E
- 1315 E Jackson Ave N
- 306 N Boyd St
- 306 N Boyd Place
- 1313 E Jackson Ave N
- 402 N Brown St
- 303 N Boyd St
- 1309 E Jackson Ave N
- 1322 E Jackson Ave N
- 401 N Hodge St
- 1316 E Jackson Ave N
- 1400 E Jackson Ave N
- 1307 E Jackson Ave N
- 406 N Brown St
- 1314 E Jackson Ave N
- 1407 E Line Ave
- 1305 E Jackson Ave N
Your Personal Tour Guide
Ask me questions while you tour the home.