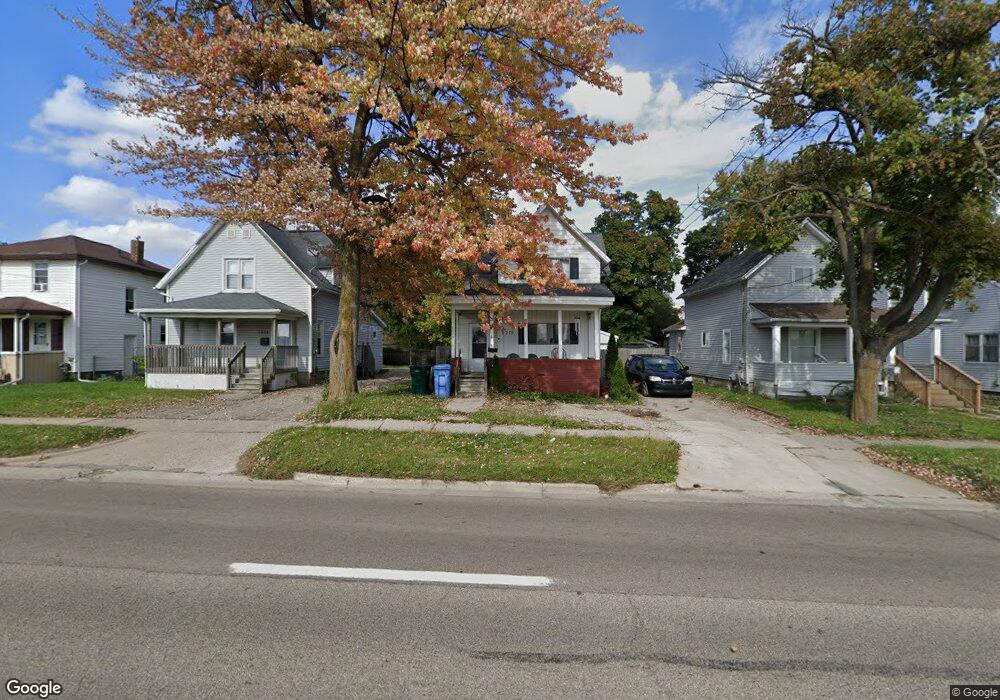
1319 E Saginaw St Lansing, MI 48906
Northtown NeighborhoodEstimated Value: $98,000 - $159,000
--
Bed
--
Bath
1,733
Sq Ft
$83/Sq Ft
Est. Value
About This Home
This home is located at 1319 E Saginaw St, Lansing, MI 48906 and is currently estimated at $143,063, approximately $82 per square foot. 1319 E Saginaw St is a home located in Ingham County with nearby schools including Pattengill Academy, Willow School, and Eastern Lansing High School.
Ownership History
Date
Name
Owned For
Owner Type
Purchase Details
Closed on
Mar 4, 2016
Sold by
Zemer Gerad and Zemer Martha
Bought by
Tucio Jeffery and Tucio Alexandra
Current Estimated Value
Home Financials for this Owner
Home Financials are based on the most recent Mortgage that was taken out on this home.
Original Mortgage
$77,716
Outstanding Balance
$61,958
Interest Rate
3.87%
Mortgage Type
FHA
Estimated Equity
$81,105
Purchase Details
Closed on
Sep 23, 2002
Sold by
The Cit Group/Consumer Finance Inc
Bought by
Zemer Gerald and Zemer Martha
Home Financials for this Owner
Home Financials are based on the most recent Mortgage that was taken out on this home.
Original Mortgage
$51,750
Interest Rate
6.29%
Mortgage Type
Purchase Money Mortgage
Purchase Details
Closed on
Jul 11, 2002
Sold by
Pamp Elizabeth and Pamp Judy
Bought by
The Cit Group/Consumer Finance Inc
Purchase Details
Closed on
Jun 17, 1997
Sold by
Petoskey Florence L
Bought by
Pamp Elizabeth and Pamp Judy
Create a Home Valuation Report for This Property
The Home Valuation Report is an in-depth analysis detailing your home's value as well as a comparison with similar homes in the area
Home Values in the Area
Average Home Value in this Area
Purchase History
| Date | Buyer | Sale Price | Title Company |
|---|---|---|---|
| Tucio Jeffery | $80,400 | None Available | |
| Zemer Gerald | $57,500 | -- | |
| The Cit Group/Consumer Finance Inc | $35,424 | -- | |
| Pamp Elizabeth | $54,000 | -- |
Source: Public Records
Mortgage History
| Date | Status | Borrower | Loan Amount |
|---|---|---|---|
| Open | Tucio Jeffery | $77,716 | |
| Previous Owner | Zemer Gerald | $51,750 |
Source: Public Records
Tax History Compared to Growth
Tax History
| Year | Tax Paid | Tax Assessment Tax Assessment Total Assessment is a certain percentage of the fair market value that is determined by local assessors to be the total taxable value of land and additions on the property. | Land | Improvement |
|---|---|---|---|---|
| 2025 | $3,146 | $70,800 | $4,800 | $66,000 |
| 2024 | $25 | $61,400 | $4,800 | $56,600 |
| 2023 | $2,949 | $52,500 | $4,800 | $47,700 |
| 2022 | $2,659 | $50,000 | $3,400 | $46,600 |
| 2021 | $2,603 | $44,100 | $3,900 | $40,200 |
| 2020 | $2,587 | $43,000 | $3,900 | $39,100 |
| 2019 | $2,558 | $40,600 | $3,900 | $36,700 |
| 2018 | $2,338 | $39,800 | $3,900 | $35,900 |
| 2017 | $2,278 | $39,800 | $3,900 | $35,900 |
| 2016 | $1,857 | $26,100 | $3,900 | $22,200 |
| 2015 | $1,857 | $25,300 | $7,730 | $17,570 |
| 2014 | $1,857 | $24,500 | $7,730 | $16,770 |
Source: Public Records
Map
Nearby Homes
- 1423 Academy Ln
- 501 Worthington Dr
- 1107 May St
- 1408 E Oakland Ave
- 602 N Pennsylvania Ave
- 1014 E Oakland Ave
- 941 Maryland Ave
- 1206 Porter St
- 904 Linden Grove Ave
- 838 May St
- 331 N Pennsylvania Ave
- 837 E Shiawassee St
- 127 Ferguson St
- 1320 Jerome St
- 125 Ferguson St
- 1316 Jerome St
- 928 Porter St
- 123 Ferguson St Unit 1
- 1141 Farrand St
- 1127 Camp St
- 1323 E Saginaw St
- 1315 E Saginaw St
- 1325 E Saginaw St
- 1311 E Saginaw St
- 713 Clark St
- 1329 E Saginaw St
- 1307 E Saginaw St
- 719 Clark St
- 710 Cleveland St
- 721 Clark St
- 1301 E Saginaw St
- 652 Worthington Dr Unit 71
- 650 Worthington Dr Unit 64
- 670 Worthington Dr
- 670 Worthington Dr Unit 63
- 670 Worthington Dr Unit 48
- 654 Worthington Dr Unit 72
- 658 Worthington Dr Unit 65
- 718 Cleveland St
- 725 Clark St