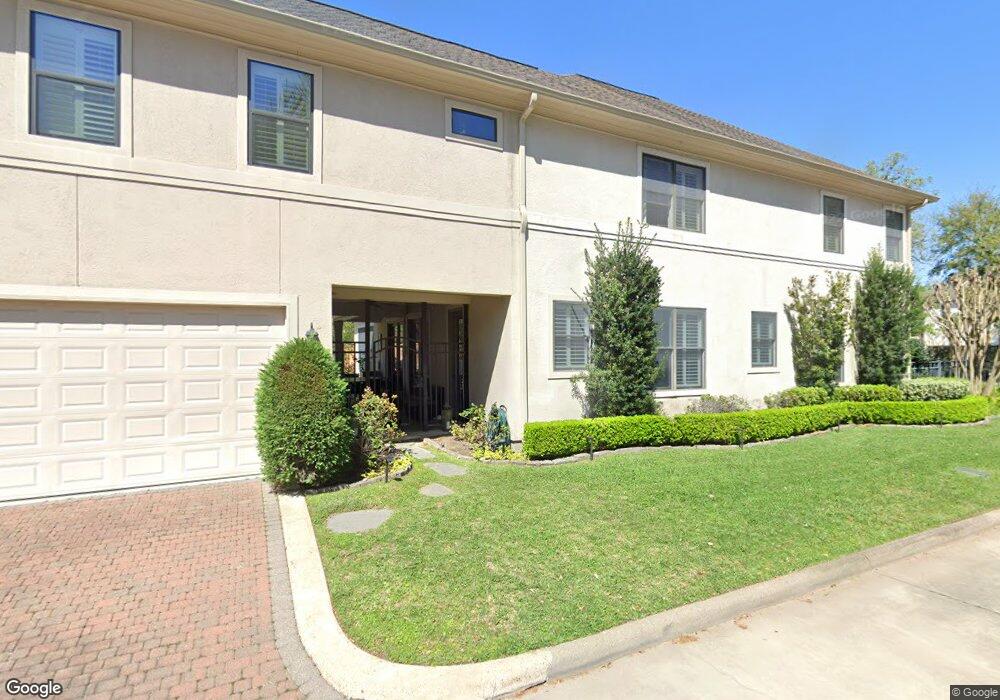
1319 Glenhilshire Dr Houston, TX 77055
Estimated Value: $1,681,966 - $2,111,000
5
Beds
5
Baths
4,571
Sq Ft
$411/Sq Ft
Est. Value
About This Home
This home is located at 1319 Glenhilshire Dr, Houston, TX 77055 and is currently estimated at $1,879,492, approximately $411 per square foot. 1319 Glenhilshire Dr is a home located in Harris County with nearby schools including Valley Oaks Elementary School, Spring Branch Middle School, and Memorial High School.
Ownership History
Date
Name
Owned For
Owner Type
Purchase Details
Closed on
Mar 21, 2013
Sold by
Prichard Rickie and Prichard Rickie J
Bought by
Shaw Robert S and Shaw Florence
Current Estimated Value
Purchase Details
Closed on
Apr 30, 2007
Sold by
Pavageau Philippe J and Pavageau Anne M
Bought by
Prichard Rickie
Home Financials for this Owner
Home Financials are based on the most recent Mortgage that was taken out on this home.
Original Mortgage
$235,000
Interest Rate
6.13%
Mortgage Type
Purchase Money Mortgage
Purchase Details
Closed on
Nov 20, 2002
Sold by
Ehd Developers Llc
Bought by
Stein James D
Home Financials for this Owner
Home Financials are based on the most recent Mortgage that was taken out on this home.
Original Mortgage
$426,750
Interest Rate
5.89%
Create a Home Valuation Report for This Property
The Home Valuation Report is an in-depth analysis detailing your home's value as well as a comparison with similar homes in the area
Home Values in the Area
Average Home Value in this Area
Purchase History
| Date | Buyer | Sale Price | Title Company |
|---|---|---|---|
| Shaw Robert S | -- | None Available | |
| Prichard Rickie | -- | Charter Title Company | |
| Stein James D | -- | Charter Title Company |
Source: Public Records
Mortgage History
| Date | Status | Borrower | Loan Amount |
|---|---|---|---|
| Previous Owner | Prichard Rickie | $235,000 | |
| Previous Owner | Stein James D | $426,750 |
Source: Public Records
Tax History Compared to Growth
Tax History
| Year | Tax Paid | Tax Assessment Tax Assessment Total Assessment is a certain percentage of the fair market value that is determined by local assessors to be the total taxable value of land and additions on the property. | Land | Improvement |
|---|---|---|---|---|
| 2025 | $23,073 | $1,624,000 | $680,049 | $943,951 |
| 2024 | $23,073 | $1,350,000 | $680,049 | $669,951 |
| 2023 | $23,073 | $1,437,920 | $623,378 | $814,542 |
| 2022 | $30,964 | $1,300,000 | $566,708 | $733,292 |
| 2021 | $31,379 | $1,275,000 | $566,708 | $708,292 |
| 2020 | $35,150 | $1,407,847 | $629,675 | $778,172 |
| 2019 | $33,358 | $1,283,958 | $629,675 | $654,283 |
| 2018 | $6,495 | $1,278,284 | $629,675 | $648,609 |
| 2017 | $32,110 | $1,278,284 | $629,675 | $648,609 |
| 2016 | $31,796 | $1,265,770 | $629,675 | $636,095 |
| 2015 | $19,995 | $1,310,005 | $541,521 | $768,484 |
| 2014 | $19,995 | $985,000 | $465,960 | $519,040 |
Source: Public Records
Map
Nearby Homes
- 8206 Westview Dr
- 1310 Pine Chase Dr
- 1421 Glenmore Forest St
- 1523 Cunningham Parc Ln
- 1529 Wirt Rd Unit 27
- 1529 Wirt Rd Unit 6
- 1529 Wirt Rd Unit 19
- 1529 Wirt Rd Unit 20
- 1518 Hillendahl Blvd
- 7908 Westwood Dr
- 1519 Baggett Ln
- 8707 Padua Ln
- 7938 S Wellington Ct
- 7903 S Wellington Ct
- 1114 Guinea Dr
- 1115 Glourie Dr
- 7818 Janak Dr Unit B
- 0 Wirt Rd
- 7718 S Hunters Court Dr Unit 1
- 1724 Maravilla Dr
- 1318 Bridle Spur Ln
- 1327 Pine Chase Dr
- 1315 Glenhilshire Dr
- 1314 Bridle Spur Ln
- 1316 Glenhilshire Dr
- 1323 Pine Chase Dr
- 1401 Pine Chase Dr
- 1402 Pine Chase Dr
- 1317 Bridle Spur Ln
- 8002 Westview Dr
- 1319 Pine Chase Dr
- 1310 Bridle Spur Ln
- 1405 Pine Chase Dr
- 1324 Pine Chase Dr
- 8120 Westview Dr
- 1406 Pine Chase Dr
- 1311 Glenhilshire Dr
- 1401 Glourie Dr
- 1400 Monarch Oaks St
- 1307 Glenhilshire Dr