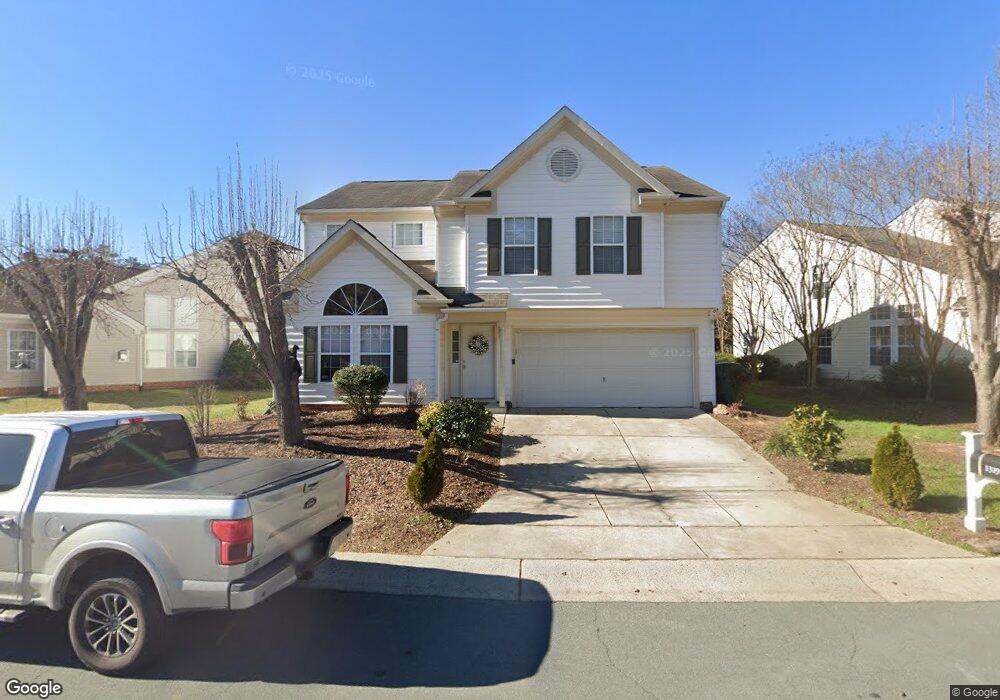
1319 Pebble Creek Crossing Durham, NC 27713
Woodcroft NeighborhoodEstimated Value: $444,000 - $474,000
3
Beds
3
Baths
2,193
Sq Ft
$208/Sq Ft
Est. Value
About This Home
This home is located at 1319 Pebble Creek Crossing, Durham, NC 27713 and is currently estimated at $456,399, approximately $208 per square foot. 1319 Pebble Creek Crossing is a home located in Durham County with nearby schools including Pearsontown Elementary School, Lowe's Grove Middle, and Hillside High School.
Ownership History
Date
Name
Owned For
Owner Type
Purchase Details
Closed on
Jun 7, 2017
Sold by
Secretary Of Hud
Bought by
Bajwa Sinderpal K and Bajwa Harminderpal
Current Estimated Value
Purchase Details
Closed on
Mar 21, 2017
Sold by
Flagstar Bank Fsb
Bought by
Sec Of Housing & Urban
Purchase Details
Closed on
Nov 17, 2016
Sold by
Pratt Benjamin C
Bought by
Flagstar Bank Fsb
Purchase Details
Closed on
Aug 30, 2005
Sold by
Nunez Ibis M
Bought by
Pratt Benjamin C and Pratt Jacqueline M B
Home Financials for this Owner
Home Financials are based on the most recent Mortgage that was taken out on this home.
Original Mortgage
$211,000
Interest Rate
7.99%
Mortgage Type
Fannie Mae Freddie Mac
Create a Home Valuation Report for This Property
The Home Valuation Report is an in-depth analysis detailing your home's value as well as a comparison with similar homes in the area
Home Values in the Area
Average Home Value in this Area
Purchase History
| Date | Buyer | Sale Price | Title Company |
|---|---|---|---|
| Bajwa Sinderpal K | -- | None Available | |
| Sec Of Housing & Urban | -- | -- | |
| Flagstar Bank Fsb | $210,000 | -- | |
| Pratt Benjamin C | $213,000 | -- |
Source: Public Records
Mortgage History
| Date | Status | Borrower | Loan Amount |
|---|---|---|---|
| Previous Owner | Pratt Benjamin C | $211,000 |
Source: Public Records
Tax History Compared to Growth
Tax History
| Year | Tax Paid | Tax Assessment Tax Assessment Total Assessment is a certain percentage of the fair market value that is determined by local assessors to be the total taxable value of land and additions on the property. | Land | Improvement |
|---|---|---|---|---|
| 2025 | $3,585 | $489,168 | $117,600 | $371,568 |
| 2024 | $3,585 | $256,976 | $50,445 | $206,531 |
| 2023 | $3,366 | $256,976 | $50,445 | $206,531 |
| 2022 | $3,289 | $256,976 | $50,445 | $206,531 |
| 2021 | $3,274 | $256,976 | $50,445 | $206,531 |
| 2020 | $3,197 | $256,976 | $50,445 | $206,531 |
| 2019 | $3,197 | $256,976 | $50,445 | $206,531 |
| 2018 | $3,184 | $234,718 | $46,432 | $188,286 |
| 2017 | $3,160 | $234,718 | $46,432 | $188,286 |
| 2016 | $3,054 | $234,718 | $46,432 | $188,286 |
| 2015 | $3,312 | $239,274 | $40,791 | $198,483 |
| 2014 | $3,312 | $239,274 | $40,791 | $198,483 |
Source: Public Records
Map
Nearby Homes
- 3 Newgate Ct
- 1308 Snyder St
- 1304 Copper Creek Dr
- 1017 Red Hat Ln
- 3 Chownings St
- 1 Chownings St
- 1001 Pebble Creek Crossing Unit 12
- 1003 Crimson Dr Unit 2
- 5808 Sandstone Dr
- 1022 Carpenter Fletcher Rd
- 1122 Vermillion Dr
- 6502 Barbee Rd
- 6304 Forest Ridge Dr
- 5624 Barbee Rd
- 13 Byerly Ct
- 1045 Flagler St
- 1062 Flagler St
- 8 Nutmeg Ct
- 1003 Canary Pepper Dr
- 909 Windcrest Rd
- 1323 Pebble Creek Crossing
- 1315 Pebble Creek Crossing
- 5 Newgate Ct
- 1311 Pebble Creek Crossing
- 1320 Pebble Creek Crossing
- 1318 Pebble Creek Crossing
- 1324 Pebble Creek Crossing
- 1316 Pebble Creek Crossing
- 1402 Pebble Creek Crossing
- 1309 Pebble Creek Crossing
- 7 Newgate Ct
- 1314 Pebble Creek Crossing
- 4 Newgate Ct
- 1404 Pebble Creek Crossing
- 1312 Pebble Creek Crossing
- 1403 Pebble Creek Crossing
- 1307 Pebble Creek Crossing
- 1310 Pebble Creek Crossing
- 9 Newgate Ct
- 8 Newgate Ct