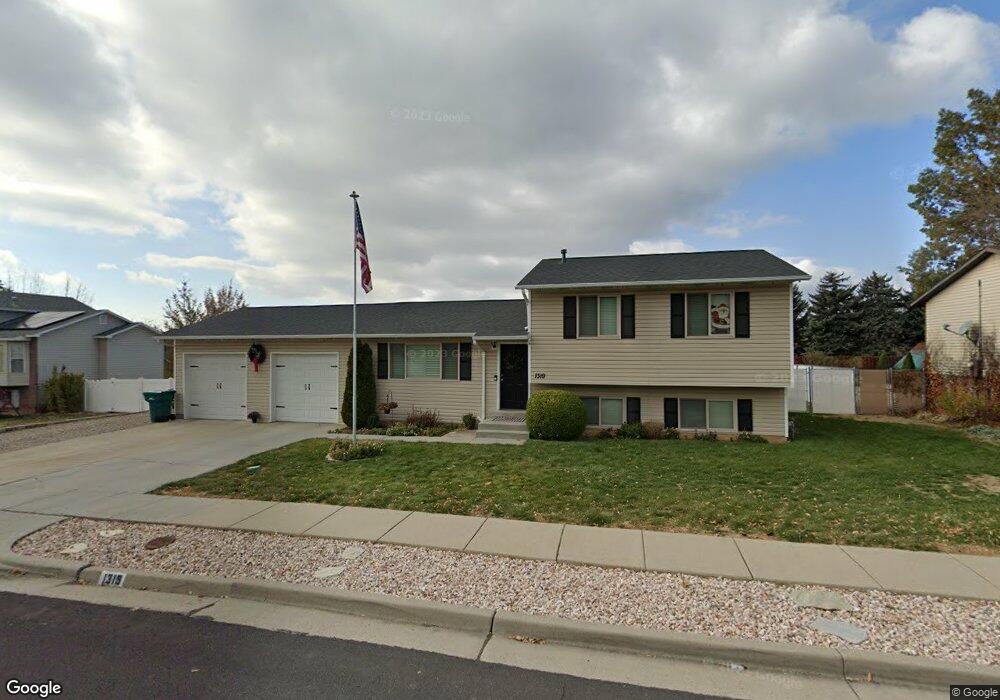
1319 Plum Tree Dr Layton, UT 84040
Estimated Value: $441,000 - $468,840
4
Beds
2
Baths
1,594
Sq Ft
$288/Sq Ft
Est. Value
About This Home
This home is located at 1319 Plum Tree Dr, Layton, UT 84040 and is currently estimated at $458,710, approximately $287 per square foot. 1319 Plum Tree Dr is a home located in Davis County with nearby schools including King Elementary School, Central Davis Junior High School, and Layton High School.
Ownership History
Date
Name
Owned For
Owner Type
Purchase Details
Closed on
Nov 20, 2023
Sold by
Harris Tucker and Harris Emilee
Bought by
Butterfield Zachary and Hopkins Paige Nicole
Current Estimated Value
Home Financials for this Owner
Home Financials are based on the most recent Mortgage that was taken out on this home.
Original Mortgage
$434,483
Outstanding Balance
$426,889
Interest Rate
7.49%
Mortgage Type
FHA
Estimated Equity
$31,821
Purchase Details
Closed on
Jan 26, 2016
Sold by
Harris Tucker
Bought by
Harris Tucker and Harris Emilee
Purchase Details
Closed on
Aug 27, 2013
Sold by
Olsen Eldon L
Bought by
Harris Tucker
Home Financials for this Owner
Home Financials are based on the most recent Mortgage that was taken out on this home.
Original Mortgage
$151,905
Interest Rate
4.33%
Mortgage Type
New Conventional
Create a Home Valuation Report for This Property
The Home Valuation Report is an in-depth analysis detailing your home's value as well as a comparison with similar homes in the area
Home Values in the Area
Average Home Value in this Area
Purchase History
| Date | Buyer | Sale Price | Title Company |
|---|---|---|---|
| Butterfield Zachary | -- | None Listed On Document | |
| Harris Tucker | -- | Mountain View Title | |
| Harris Tucker | -- | Security Title Of Dav |
Source: Public Records
Mortgage History
| Date | Status | Borrower | Loan Amount |
|---|---|---|---|
| Open | Butterfield Zachary | $434,483 | |
| Previous Owner | Harris Tucker | $151,905 |
Source: Public Records
Tax History Compared to Growth
Tax History
| Year | Tax Paid | Tax Assessment Tax Assessment Total Assessment is a certain percentage of the fair market value that is determined by local assessors to be the total taxable value of land and additions on the property. | Land | Improvement |
|---|---|---|---|---|
| 2025 | $2,175 | $228,250 | $118,147 | $110,103 |
| 2024 | $2,091 | $221,100 | $143,037 | $78,063 |
| 2023 | $2,039 | $380,000 | $195,288 | $184,712 |
| 2022 | $2,141 | $216,700 | $104,537 | $112,163 |
| 2021 | $1,994 | $301,000 | $158,754 | $142,246 |
| 2020 | $1,733 | $251,000 | $127,193 | $123,807 |
| 2019 | $1,706 | $242,000 | $113,913 | $128,087 |
| 2018 | $1,552 | $221,000 | $87,635 | $133,365 |
| 2016 | $1,334 | $97,955 | $46,342 | $51,613 |
| 2015 | $1,278 | $89,155 | $46,342 | $42,813 |
| 2014 | $1,196 | $85,275 | $46,342 | $38,933 |
| 2013 | -- | $81,484 | $22,748 | $58,736 |
Source: Public Records
Map
Nearby Homes
- 1122 E 1250 N
- 1281 E South Lisa St
- 1884 Nalder St
- 1200 Church St Unit 66
- 1252 E Larkspur Way
- 1266 E Larkspur Way
- 1278 E Larkspur Way
- 1340 E Hollyhock Way
- 1261 E Larkspur Way
- Richards Plan at Eastridge Park - The Vistas
- Brynlee Plan at Eastridge Park - The Vistas
- Brynlee Plan at Eastridge Park - The Heights
- Ontario Plan at Eastridge Park - The Heights
- Mclauren Plan at Eastridge Park - The Vistas
- Escher Plan at Eastridge Park - The Vistas
- Rivershore Plan at Eastridge Park - The Vistas
- Helene Plan at Eastridge Park - The Vistas
- Bromley Plan at Eastridge Park - The Heights
- Beringwood Plan at Eastridge Park - The Heights
- Caulfield Plan at Eastridge Park - The Heights
- 1297 N 950 E
- 1297 Plum Tree Dr
- 1339 Plum Tree Dr
- 1306 N Cherry Stem Cir Unit 5
- 1277 N 950 E
- 938 E Cherry Ln
- 1324 Plum Tree Dr
- 1310 Plum Tree Dr
- 1290 N 950 E
- 1277 Plum Tree Dr
- 1340 Plum Tree Dr
- 1290 Plum Tree Dr
- 1340 N 950 E
- 1261 Plum Tree Dr
- 1296 N Cherry Stem Cir Unit 4
- 1296 N Cherry Stem Cir
- 969 Springtree Dr
- 1309 N Cherry Stem Cir Unit 2
- 1309 N Cherry Stem Cir
- 1301 N Cherry Stem Cir Unit 3