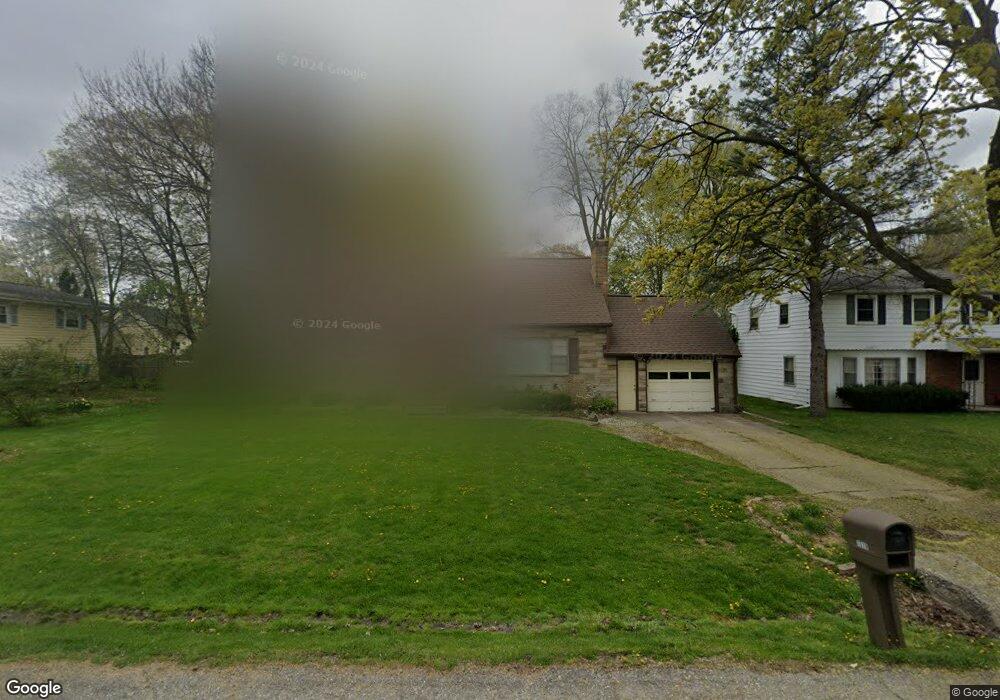
1319 Shaffer Ct Lansing, MI 48917
Edgemont Park NeighborhoodEstimated Value: $223,000 - $247,000
3
Beds
2
Baths
1,662
Sq Ft
$141/Sq Ft
Est. Value
About This Home
This home is located at 1319 Shaffer Ct, Lansing, MI 48917 and is currently estimated at $233,733, approximately $140 per square foot. 1319 Shaffer Ct is a home located in Ingham County with nearby schools including Waverly Senior High School, Windemere Park Charter Academy, and St. Gerard Elementary School.
Ownership History
Date
Name
Owned For
Owner Type
Purchase Details
Closed on
Jul 1, 2010
Sold by
Frechen Michelle L and Frechen Erich L
Bought by
Federal National Mortgage Association
Current Estimated Value
Purchase Details
Closed on
Aug 19, 2004
Sold by
Vanregenmorter Adam A and Vanregenmorter Joy
Bought by
Frenchen Erich L and Frenchen Michelle L
Home Financials for this Owner
Home Financials are based on the most recent Mortgage that was taken out on this home.
Original Mortgage
$152,400
Interest Rate
6.08%
Mortgage Type
Purchase Money Mortgage
Purchase Details
Closed on
Dec 5, 2002
Sold by
Todd Joseph F and Todd Catherine M
Bought by
Vanregenmorter Adam A and Vanregenmorter Joy
Home Financials for this Owner
Home Financials are based on the most recent Mortgage that was taken out on this home.
Original Mortgage
$124,700
Interest Rate
6.23%
Mortgage Type
Purchase Money Mortgage
Purchase Details
Closed on
May 22, 1997
Sold by
Stone Calen D and Stone Carrie L
Bought by
Todd Joseph F and Todd Catherine M
Purchase Details
Closed on
May 26, 1993
Create a Home Valuation Report for This Property
The Home Valuation Report is an in-depth analysis detailing your home's value as well as a comparison with similar homes in the area
Home Values in the Area
Average Home Value in this Area
Purchase History
| Date | Buyer | Sale Price | Title Company |
|---|---|---|---|
| Federal National Mortgage Association | $63,675 | None Available | |
| Frenchen Erich L | $152,900 | Midstate | |
| Vanregenmorter Adam A | $155,900 | Midstate Title Company | |
| Todd Joseph F | $116,000 | -- | |
| -- | $89,900 | -- |
Source: Public Records
Mortgage History
| Date | Status | Borrower | Loan Amount |
|---|---|---|---|
| Previous Owner | Frenchen Erich L | $152,400 | |
| Previous Owner | Vanregenmorter Adam A | $124,700 | |
| Closed | Vanregenmorter Adam A | $31,200 |
Source: Public Records
Tax History
| Year | Tax Paid | Tax Assessment Tax Assessment Total Assessment is a certain percentage of the fair market value that is determined by local assessors to be the total taxable value of land and additions on the property. | Land | Improvement |
|---|---|---|---|---|
| 2025 | $4,164 | $113,000 | $34,000 | $79,000 |
| 2024 | $20 | $103,800 | $27,500 | $76,300 |
| 2023 | $4,037 | $91,500 | $27,500 | $64,000 |
| 2022 | $3,860 | $81,200 | $25,200 | $56,000 |
| 2021 | $3,878 | $77,400 | $22,200 | $55,200 |
| 2020 | $3,602 | $75,300 | $22,200 | $53,100 |
| 2019 | $3,521 | $70,900 | $16,100 | $54,800 |
| 2018 | $3,531 | $67,200 | $11,300 | $55,900 |
| 2017 | $3,309 | $67,200 | $11,300 | $55,900 |
| 2016 | -- | $61,100 | $10,300 | $50,800 |
| 2015 | -- | $59,600 | $20,625 | $38,975 |
| 2014 | -- | $56,000 | $20,625 | $35,375 |
Source: Public Records
Map
Nearby Homes
- 3723 Springbrook Ln
- 1222 Ravenswood Dr
- 1930 Briarwood Dr
- 1805 Boynton Dr
- 1115 Boynton Dr
- 3423 Upton Rd
- 1015 Westfield Rd
- 1920 Byrnes Rd
- 3003 Timber Dr
- 2817 W Willow St
- 2111 Northwest Ave
- 2206 Kuerbitz Dr
- 0 San Gabriel
- 3733 Colchester Rd
- 0000 N Dibble Ave
- 2300 Byrnes Rd
- 3500 Colchester Rd
- 2302 Northwest Ave
- 2800 Tecumseh River Rd
- 410 Renker Rd
- 1325 Shaffer Ct
- 1307 Shaffer Ct
- 3712 W Willow St
- 1405 Shaffer Ct
- 3726 W Willow St
- 1411 Shaffer Ct
- 1318 Shaffer Ct
- 1322 Shaffer Ct
- 3624 W Willow St
- 1400 Shaffer Ct
- 3711 W Willow St
- 1421 Shaffer Ct
- 3806 W Willow St
- 3719 W Willow St
- 1410 Shaffer Ct
- 3623 W Willow St
- 1315 Ravenswood Dr
- 1317 Ravenswood Dr
- 3606 W Willow St
- 1327 Ravenswood Dr
Your Personal Tour Guide
Ask me questions while you tour the home.