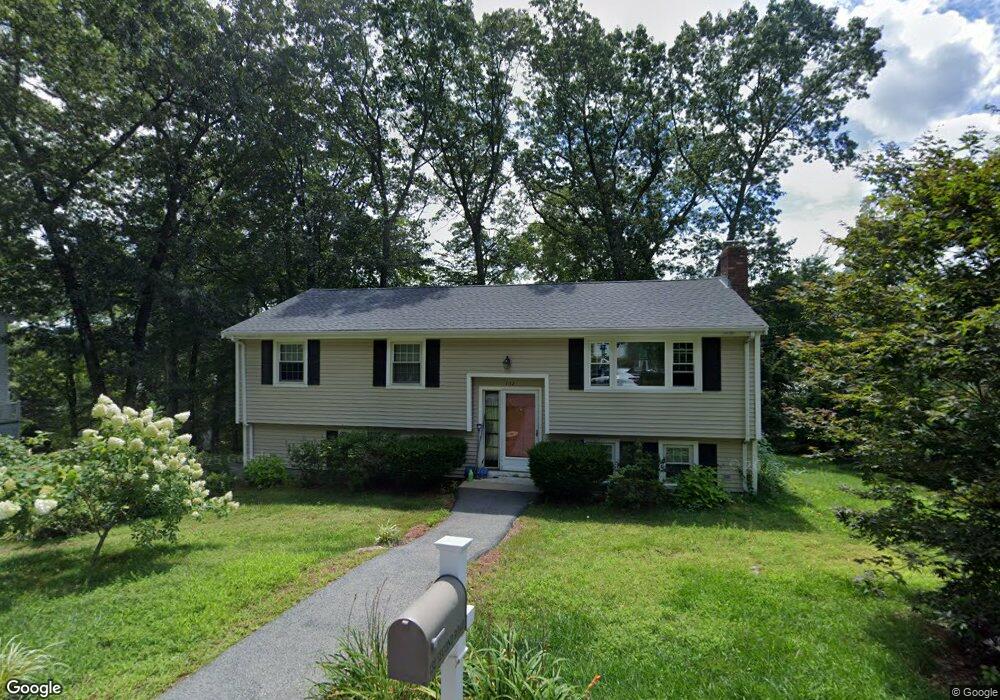
132 2nd Rd Marlborough, MA 01752
Estimated Value: $534,130 - $650,000
3
Beds
2
Baths
1,094
Sq Ft
$535/Sq Ft
Est. Value
About This Home
This home is located at 132 2nd Rd, Marlborough, MA 01752 and is currently estimated at $585,283, approximately $534 per square foot. 132 2nd Rd is a home located in Middlesex County with nearby schools including Marlborough High School, First Steps Children's Center, and New Covenant Christian School.
Ownership History
Date
Name
Owned For
Owner Type
Purchase Details
Closed on
Jan 14, 2021
Sold by
Janis Bergstrom Ft 2020
Bought by
Bergstrom Mark F
Current Estimated Value
Purchase Details
Closed on
Mar 4, 2020
Sold by
Bergstrom Janis A
Bought by
Janis A Bergstrom Ft 2020
Purchase Details
Closed on
May 1, 1992
Sold by
Schafer Ralph G and Schafer Nancy E
Bought by
Bergstrom Janis A
Create a Home Valuation Report for This Property
The Home Valuation Report is an in-depth analysis detailing your home's value as well as a comparison with similar homes in the area
Home Values in the Area
Average Home Value in this Area
Purchase History
| Date | Buyer | Sale Price | Title Company |
|---|---|---|---|
| Bergstrom Mark F | -- | None Available | |
| Janis A Bergstrom Ft 2020 | -- | None Available | |
| Bergstrom Janis A | $131,000 | -- |
Source: Public Records
Mortgage History
| Date | Status | Borrower | Loan Amount |
|---|---|---|---|
| Previous Owner | Bergstrom Janis A | $210,000 | |
| Previous Owner | Bergstrom Janis A | $15,000 | |
| Previous Owner | Bergstrom Janis A | $100,000 |
Source: Public Records
Tax History Compared to Growth
Tax History
| Year | Tax Paid | Tax Assessment Tax Assessment Total Assessment is a certain percentage of the fair market value that is determined by local assessors to be the total taxable value of land and additions on the property. | Land | Improvement |
|---|---|---|---|---|
| 2025 | $4,695 | $476,200 | $220,000 | $256,200 |
| 2024 | $4,576 | $446,900 | $200,000 | $246,900 |
| 2023 | $4,933 | $427,500 | $168,700 | $258,800 |
| 2022 | $4,812 | $366,800 | $160,700 | $206,100 |
| 2021 | $11,552 | $334,100 | $133,900 | $200,200 |
| 2020 | $5,146 | $318,900 | $127,500 | $191,400 |
| 2019 | $4,411 | $313,500 | $125,000 | $188,500 |
| 2018 | $4,371 | $298,800 | $99,300 | $199,500 |
| 2017 | $4,310 | $281,300 | $98,500 | $182,800 |
| 2016 | $4,188 | $273,000 | $98,500 | $174,500 |
| 2015 | $3,710 | $235,400 | $100,700 | $134,700 |
Source: Public Records
Map
Nearby Homes
- 48 Jewell Rd Unit Lot 6
- 46 Jewell Rd Unit Lot 5
- 44 Jewell Rd Unit Lot 4
- 30 Jewell Rd Unit Lot 2
- 36 Jewell Rd Unit Lot 3
- 1 Rotherham Way Unit B
- 656 Bolton St
- 129 Fort Meadow Dr
- 0 Washington St
- 114 Lodi Rd
- 18 Collins Dr
- 243 Washington St
- 18 Amory Rd
- 57 Paquin Dr
- 315 Bolton St
- 3 Townsend Rd
- 377 Hosmer St
- 135 Broad St Unit 2B3
- 2 Blueberry Ln
- 44 Stevens Rd