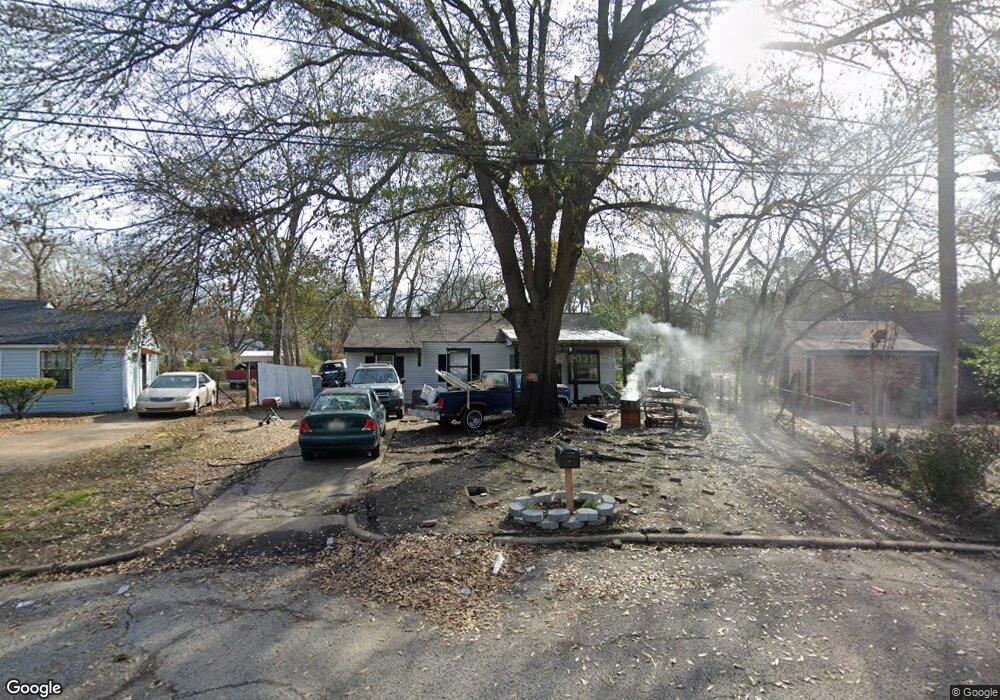
132 Azalea Dr Montgomery, AL 36105
Estimated Value: $23,000 - $48,675
3
Beds
1
Bath
1,312
Sq Ft
$31/Sq Ft
Est. Value
About This Home
This home is located at 132 Azalea Dr, Montgomery, AL 36105 and is currently estimated at $40,169, approximately $30 per square foot. 132 Azalea Dr is a home located in Montgomery County with nearby schools including Bellingrath Junior High School, Lanier Senior High School, and Davis Elementary School.
Ownership History
Date
Name
Owned For
Owner Type
Purchase Details
Closed on
Feb 16, 2005
Sold by
Jp Morgan Chase Bank
Bought by
Thornell Jeff
Current Estimated Value
Purchase Details
Closed on
Jun 15, 2004
Sold by
Robinson Tony
Bought by
Jp Morgan Chase Bank
Purchase Details
Closed on
Feb 22, 2001
Sold by
Eastern United Life Insurance Co Inc
Bought by
Robinson Tony
Home Financials for this Owner
Home Financials are based on the most recent Mortgage that was taken out on this home.
Original Mortgage
$22,000
Interest Rate
6.91%
Purchase Details
Closed on
Jul 26, 2000
Sold by
Knox Sylvester and Knox Cheryl
Bought by
Western United Life Assurance Company
Purchase Details
Closed on
May 13, 1998
Sold by
Alvin Lawson
Bought by
Knox Sylvester and Knox Cheryl
Home Financials for this Owner
Home Financials are based on the most recent Mortgage that was taken out on this home.
Original Mortgage
$36,000
Interest Rate
7.1%
Mortgage Type
Seller Take Back
Create a Home Valuation Report for This Property
The Home Valuation Report is an in-depth analysis detailing your home's value as well as a comparison with similar homes in the area
Home Values in the Area
Average Home Value in this Area
Purchase History
| Date | Buyer | Sale Price | Title Company |
|---|---|---|---|
| Thornell Jeff | $10,000 | -- | |
| Jp Morgan Chase Bank | $26,350 | -- | |
| Robinson Tony | -- | -- | |
| Western United Life Assurance Company | $40,328 | -- | |
| Knox Sylvester | -- | -- |
Source: Public Records
Mortgage History
| Date | Status | Borrower | Loan Amount |
|---|---|---|---|
| Previous Owner | Robinson Tony | $22,000 | |
| Previous Owner | Knox Sylvester | $36,000 |
Source: Public Records
Tax History Compared to Growth
Tax History
| Year | Tax Paid | Tax Assessment Tax Assessment Total Assessment is a certain percentage of the fair market value that is determined by local assessors to be the total taxable value of land and additions on the property. | Land | Improvement |
|---|---|---|---|---|
| 2025 | $281 | $3,020 | $250 | $2,770 |
| 2024 | $264 | $2,650 | $250 | $2,400 |
| 2023 | $264 | $4,940 | $500 | $4,440 |
| 2022 | $184 | $4,860 | $500 | $4,360 |
| 2021 | $147 | $3,840 | $500 | $3,340 |
| 2020 | $147 | $3,840 | $500 | $3,340 |
| 2019 | $140 | $3,840 | $500 | $3,340 |
| 2018 | $140 | $1,920 | $250 | $1,670 |
| 2017 | $175 | $4,800 | $500 | $4,300 |
| 2014 | -- | $2,400 | $250 | $2,150 |
| 2013 | -- | $2,190 | $250 | $1,940 |
Source: Public Records
Map
Nearby Homes
- 131 Azalea Dr
- 303 Azalea Dr
- 210 Canna Dr
- 3862 Happiness Ave
- 3906 S Court St
- 501 Japonica St
- 3921 S Court St
- 203 W Woodland Dr
- 378 W Delano Ave
- 351 Collinwood Ave
- 3827 Edgar D Nixon Ave
- 331 W Delano Ave
- 101 E Woodland Dr
- 212 W Delano Ave
- 3751 Southmont Dr
- 113 Kelley Ln
- 3867 Southmont Dr
- 644 Iris Ln
- 244 Burgwyn Rd
- 212 Burgwyn Rd