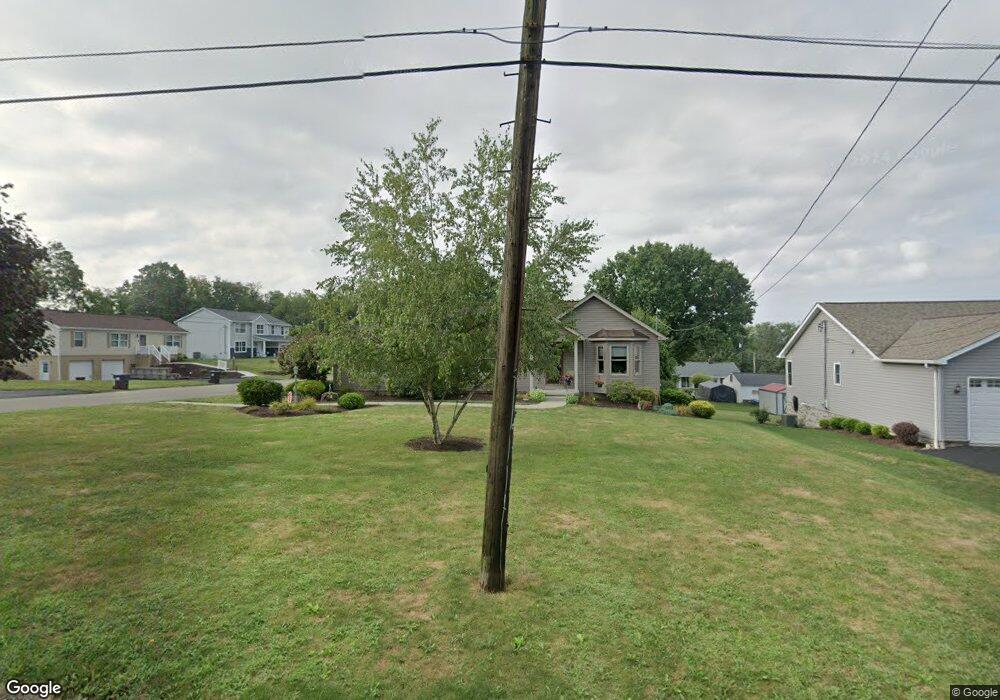
132 Barker Ave New Brighton, PA 15066
Daugherty Township NeighborhoodEstimated Value: $258,000 - $340,000
3
Beds
2
Baths
1,616
Sq Ft
$190/Sq Ft
Est. Value
About This Home
This home is located at 132 Barker Ave, New Brighton, PA 15066 and is currently estimated at $307,771, approximately $190 per square foot. 132 Barker Ave is a home with nearby schools including New Brighton Elementary School, New Brighton Area Middle School, and New Brighton Area High School.
Ownership History
Date
Name
Owned For
Owner Type
Purchase Details
Closed on
Dec 18, 2009
Sold by
Stewart Thomas E and Stewart Deborah
Bought by
Show Douglas E and Show Nancy A
Current Estimated Value
Home Financials for this Owner
Home Financials are based on the most recent Mortgage that was taken out on this home.
Original Mortgage
$164,300
Outstanding Balance
$109,922
Interest Rate
4.92%
Mortgage Type
Future Advance Clause Open End Mortgage
Estimated Equity
$197,849
Create a Home Valuation Report for This Property
The Home Valuation Report is an in-depth analysis detailing your home's value as well as a comparison with similar homes in the area
Home Values in the Area
Average Home Value in this Area
Purchase History
| Date | Buyer | Sale Price | Title Company |
|---|---|---|---|
| Show Douglas E | $30,000 | None Available |
Source: Public Records
Mortgage History
| Date | Status | Borrower | Loan Amount |
|---|---|---|---|
| Open | Show Douglas E | $164,300 |
Source: Public Records
Tax History Compared to Growth
Tax History
| Year | Tax Paid | Tax Assessment Tax Assessment Total Assessment is a certain percentage of the fair market value that is determined by local assessors to be the total taxable value of land and additions on the property. | Land | Improvement |
|---|---|---|---|---|
| 2025 | $2,968 | $146,700 | $16,500 | $130,200 |
| 2024 | $4,882 | $146,700 | $16,500 | $130,200 |
| 2023 | $4,322 | $40,600 | $6,300 | $34,300 |
| 2022 | $4,261 | $40,600 | $6,300 | $34,300 |
| 2021 | $4,262 | $40,600 | $6,300 | $34,300 |
| 2020 | $4,125 | $40,600 | $6,300 | $34,300 |
| 2019 | $4,126 | $40,600 | $6,300 | $34,300 |
| 2018 | $3,937 | $40,600 | $6,300 | $34,300 |
| 2017 | $3,937 | $40,600 | $6,300 | $34,300 |
| 2016 | $3,695 | $40,600 | $6,300 | $34,300 |
| 2015 | $901 | $40,600 | $6,300 | $34,300 |
| 2014 | $901 | $40,600 | $6,300 | $34,300 |
Source: Public Records
Map
Nearby Homes