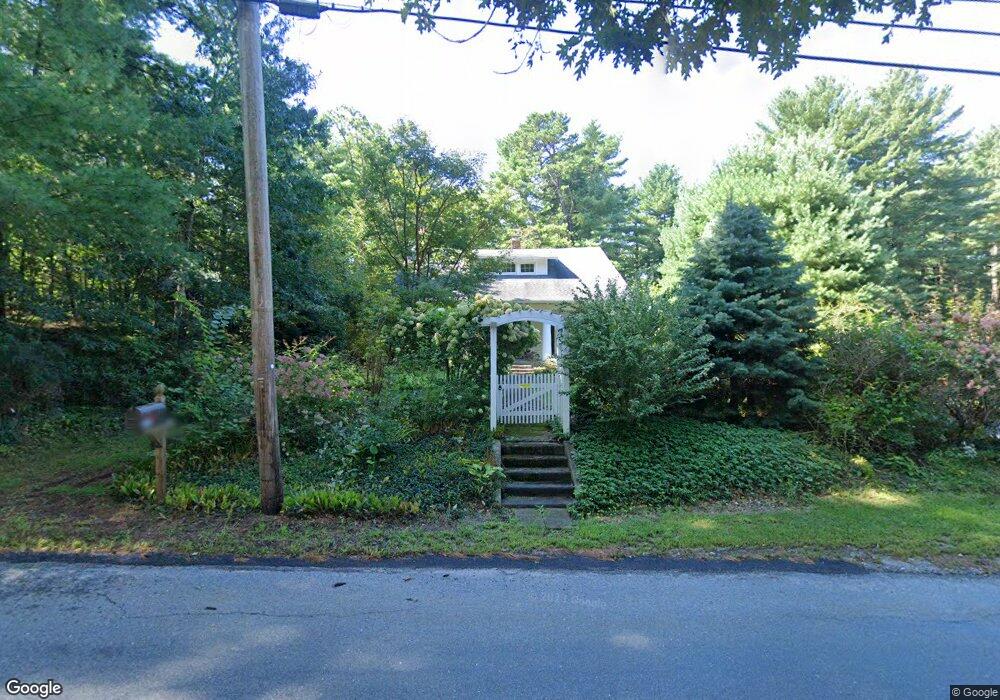
132 Beach St Wrentham, MA 02093
Estimated Value: $688,000 - $830,000
3
Beds
2
Baths
2,618
Sq Ft
$284/Sq Ft
Est. Value
About This Home
This home is located at 132 Beach St, Wrentham, MA 02093 and is currently estimated at $744,398, approximately $284 per square foot. 132 Beach St is a home located in Norfolk County with nearby schools including Delaney Elementary School and Charles E Roderick.
Ownership History
Date
Name
Owned For
Owner Type
Purchase Details
Closed on
Nov 14, 1989
Sold by
Pettigrossi Sal E
Bought by
Bristol Edward M
Current Estimated Value
Home Financials for this Owner
Home Financials are based on the most recent Mortgage that was taken out on this home.
Original Mortgage
$60,000
Interest Rate
10.03%
Mortgage Type
Purchase Money Mortgage
Create a Home Valuation Report for This Property
The Home Valuation Report is an in-depth analysis detailing your home's value as well as a comparison with similar homes in the area
Home Values in the Area
Average Home Value in this Area
Purchase History
| Date | Buyer | Sale Price | Title Company |
|---|---|---|---|
| Bristol Edward M | $176,000 | -- |
Source: Public Records
Mortgage History
| Date | Status | Borrower | Loan Amount |
|---|---|---|---|
| Closed | Bristol Edward M | $55,000 | |
| Closed | Bristol Edward M | $60,000 |
Source: Public Records
Tax History Compared to Growth
Tax History
| Year | Tax Paid | Tax Assessment Tax Assessment Total Assessment is a certain percentage of the fair market value that is determined by local assessors to be the total taxable value of land and additions on the property. | Land | Improvement |
|---|---|---|---|---|
| 2025 | $7,070 | $610,000 | $263,500 | $346,500 |
| 2024 | $6,812 | $567,700 | $263,500 | $304,200 |
| 2023 | $6,718 | $532,300 | $239,500 | $292,800 |
| 2022 | $6,470 | $473,300 | $232,900 | $240,400 |
| 2021 | $6,395 | $454,500 | $217,700 | $236,800 |
| 2020 | $5,770 | $404,900 | $166,300 | $238,600 |
| 2019 | $5,846 | $414,000 | $182,900 | $231,100 |
| 2018 | $5,421 | $380,700 | $183,100 | $197,600 |
| 2017 | $5,076 | $356,200 | $179,500 | $176,700 |
| 2016 | $4,858 | $340,200 | $174,400 | $165,800 |
| 2015 | $4,690 | $313,100 | $167,600 | $145,500 |
| 2014 | $4,613 | $301,300 | $161,200 | $140,100 |
Source: Public Records
Map
Nearby Homes
- 791 South St Unit 5
- Lot 1 - Blueberry 2 Car Plan at King Philip Estates
- Lot 8 - Blueberry 2 Car Plan at King Philip Estates
- Lot 5 - Hughes 2 car Plan at King Philip Estates
- Lot 6 - Blueberry 3 Car Plan at King Philip Estates
- Lot 2 - Camden 2 Car Plan at King Philip Estates
- Lot 7 - Cedar Plan at King Philip Estates
- Lot 4 - Hemingway 2 Car Plan at King Philip Estates
- Lot 3 - Blueberry 2 Car Plan at King Philip Estates
- Lot 3 - 14 Earle Stewart Ln
- 11 Earle Stewart Ln
- 319 Taunton St
- 131 Creek St Unit 7
- 10 Nature View Dr
- 15 Nature View Dr
- 1204 South St
- 1222 South St
- 570 Franklin St
- 50 Green St
- 362 East St